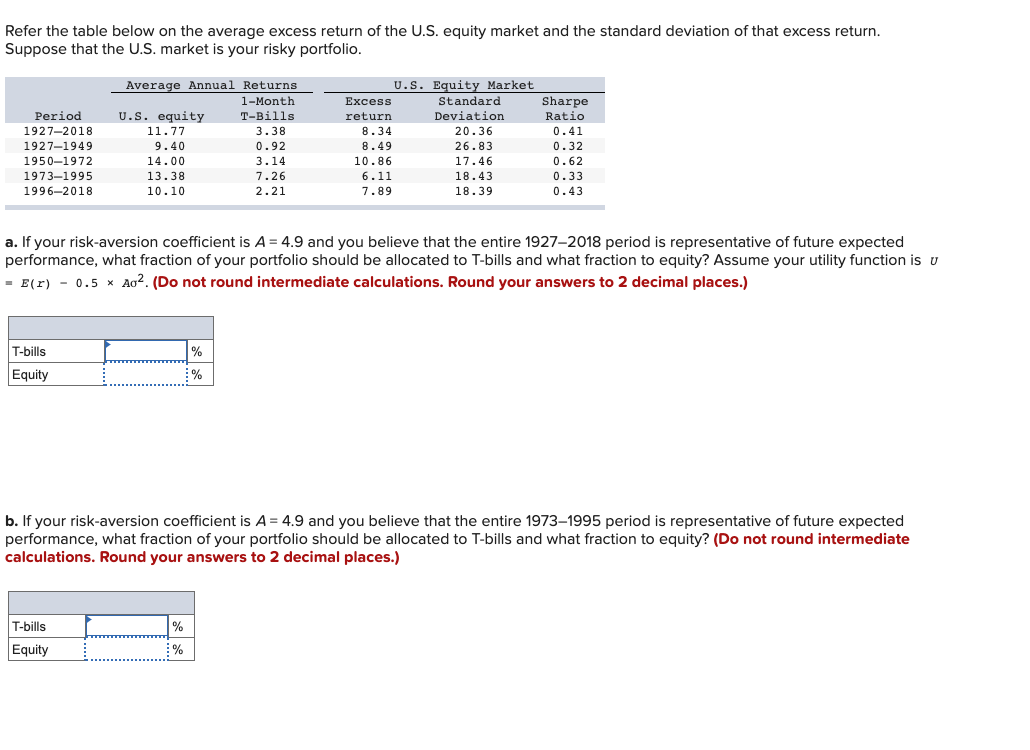
Refer the table below on the average excess return of the U.S. equity market and the standard deviation of that excess return. Suppose that the U.S. market is your risky portfolio. Average Annual Returns 1-Month U.S. Equity Market Standard Sharpe Ratio 0.41 Еxcess Period 1927-2018 1927-1949 U.S. equity 11.77 T-Bills 3.38 Deviation 20.36 26.83 return 8.34 0.41 9.40 14.00 13.38 10.10 0.92 8.49 0.32 1950-1972 3.14 10.86 17.46 0.62 7.26 18.43 18.39 1973–1995 6.11 0.33 1996–2018 2.21 7.89 0.43 a. If your risk-aversion coefficient is A = 4.9 and you believe that the entire 1927–2018 period is representative of future expected performance, what fraction of your portfolio should be allocated to T-bills and what fraction to equity? Assume your utility function is u - E(r) - 0.5 x Ao². (Do not round intermediate calculations. Round your answers to 2 decimal places.) T-bills % Equity b. If your risk-aversion coefficient is A = 4.9 and you believe that the entire 1973–1995 period is representative of future expected performance, what fraction of your portfolio should be allocated to T-bills and what fraction to equity? (Do not round intermediate calculations. Round your answers to 2 decimal places.) T-bills % Equity %
Refer the table below on the average excess return of the U.S. equity market and the standard deviation of that excess return. Suppose that the U.S. market is your risky portfolio. Average Annual Returns 1-Month U.S. Equity Market Standard Sharpe Ratio 0.41 Еxcess Period 1927-2018 1927-1949 U.S. equity 11.77 T-Bills 3.38 Deviation 20.36 26.83 return 8.34 0.41 9.40 14.00 13.38 10.10 0.92 8.49 0.32 1950-1972 3.14 10.86 17.46 0.62 7.26 18.43 18.39 1973–1995 6.11 0.33 1996–2018 2.21 7.89 0.43 a. If your risk-aversion coefficient is A = 4.9 and you believe that the entire 1927–2018 period is representative of future expected performance, what fraction of your portfolio should be allocated to T-bills and what fraction to equity? Assume your utility function is u - E(r) - 0.5 x Ao². (Do not round intermediate calculations. Round your answers to 2 decimal places.) T-bills % Equity b. If your risk-aversion coefficient is A = 4.9 and you believe that the entire 1973–1995 period is representative of future expected performance, what fraction of your portfolio should be allocated to T-bills and what fraction to equity? (Do not round intermediate calculations. Round your answers to 2 decimal places.) T-bills % Equity %

Chapter8: Analysis Of Risk And Return
Section: Chapter Questions
Problem 15P

Related questions
Question
4
Transcribed Image Text:Refer the table below on the average excess return of the U.S. equity market and the standard deviation of that excess return.
Suppose that the U.S. market is your risky portfolio.
U.S. Equity Market
Standard
Average Annual Returns
1-Month
Excess
Sharpe
Period
U.S. equity
T-Bills
return
Deviation
Ratio
1927-2018
11.77
3.38
8.34
20.36
0.41
9.40
14.00
13.38
1927-1949
0.92
8.49
26.83
0.32
1950-1972
3.14
10.86
17.46
0.62
1973–1995
1996-2018
0.33
0.43
7.26
6.11
18.43
10.10
2.21
7.89
18.39
a. If your risk-aversion coefficient is A = 4.9 and you believe that the entire 1927–2018 period is representative of future expected
performance, what fraction of your portfolio should be allocated to T-bills and what fraction to equity? Assume your utility function is u
- E(r) - 0.5 x Ao2. (Do not round intermediate calculations. Round your answers to 2 decimal places.)
T-bills
%
Equity
%
b. If your risk-aversion coefficient is A = 4.9 and you believe that the entire 1973–1995 period is representative of future expected
performance, what fraction of your portfolio should be allocated to T-bills and what fraction to equity? (Do not round intermediate
calculations. Round your answers to 2 decimal places.)
T-bills
%
Equity
%
Expert Solution
This question has been solved!
Explore an expertly crafted, step-by-step solution for a thorough understanding of key concepts.

This is a popular solution!

Trending now
This is a popular solution!

Step by step
Solved in 2 steps

Recommended textbooks for you
EBK CONTEMPORARY FINANCIAL MANAGEMENT
Finance
ISBN:
9781337514835
Author:
MOYER
Publisher:
CENGAGE LEARNING - CONSIGNMENT

Essentials of Business Analytics (MindTap Course …
Statistics
ISBN:
9781305627734
Author:
Jeffrey D. Camm, James J. Cochran, Michael J. Fry, Jeffrey W. Ohlmann, David R. Anderson
Publisher:
Cengage Learning

EBK CONTEMPORARY FINANCIAL MANAGEMENT
Finance
ISBN:
9781337514835
Author:
MOYER
Publisher:
CENGAGE LEARNING - CONSIGNMENT
Essentials of Business Analytics (MindTap Course …
Statistics
ISBN:
9781305627734
Author:
Jeffrey D. Camm, James J. Cochran, Michael J. Fry, Jeffrey W. Ohlmann, David R. Anderson
Publisher:
Cengage Learning

Financial Reporting, Financial Statement Analysis…
Finance
ISBN:
9781285190907
Author:
James M. Wahlen, Stephen P. Baginski, Mark Bradshaw
Publisher:
Cengage Learning

Intermediate Financial Management (MindTap Course…
Finance
ISBN:
9781337395083
Author:
Eugene F. Brigham, Phillip R. Daves
Publisher:
Cengage Learning