) An analyst wants to evaluate portfolio X, using both the Treynor and Sharpe measures of portfolio performance. The following table provides the average annual rate of return for portfolio X, the market portfolio (as measured by the S&P 500), and US Treasury bills during the past 8 years. Average annual return Standard deviation Beta Portfolio X 10% 15% 0.50 S&P 500 11% 13% 1.00 Т-bills 6% a) Calculate the Treynor and Sharpe measures for both portfolio X and the S&P 500. Briefly explain whether portfolio X underperformed, equalled, or outperformed the S&P 500 on a risk-adjusted basis using both the Treynor ratio and the Sharpe ratio. c) Calculate the M² measure for portfolio X and explain its economic meaning using the relevant graph.
) An analyst wants to evaluate portfolio X, using both the Treynor and Sharpe measures of portfolio performance. The following table provides the average annual rate of return for portfolio X, the market portfolio (as measured by the S&P 500), and US Treasury bills during the past 8 years. Average annual return Standard deviation Beta Portfolio X 10% 15% 0.50 S&P 500 11% 13% 1.00 Т-bills 6% a) Calculate the Treynor and Sharpe measures for both portfolio X and the S&P 500. Briefly explain whether portfolio X underperformed, equalled, or outperformed the S&P 500 on a risk-adjusted basis using both the Treynor ratio and the Sharpe ratio. c) Calculate the M² measure for portfolio X and explain its economic meaning using the relevant graph.

Chapter8: Analysis Of Risk And Return
Section: Chapter Questions
Problem 25P

Related questions
Question
how to answer c
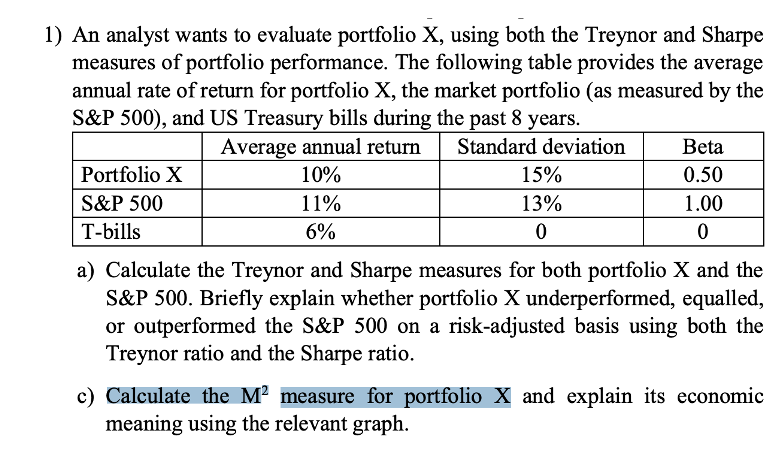
Transcribed Image Text:1) An analyst wants to evaluate portfolio X, using both the Treynor and Sharpe
measures of portfolio performance. The following table provides the average
annual rate of return for portfolio X, the market portfolio (as measured by the
S&P 500), and US Treasury bills during the past 8 years.
Average annual return
Standard deviation
Beta
Portfolio X
10%
15%
0.50
S&P 500
11%
13%
1.00
T-bills
6%
a) Calculate the Treynor and Sharpe measures for both portfolio X and the
S&P 500. Briefly explain whether portfolio X underperformed, equalled,
or outperformed the S&P 500 on a risk-adjusted basis using both the
Treynor ratio and the Sharpe ratio.
c) Calculate the M2 measure for portfolio X and explain its economic
meaning using the relevant graph.
Expert Solution
This question has been solved!
Explore an expertly crafted, step-by-step solution for a thorough understanding of key concepts.

Step by step
Solved in 2 steps with 3 images

Knowledge Booster


Learn more about
Need a deep-dive on the concept behind this application? Look no further. Learn more about this topic, finance and related others by exploring similar questions and additional content below.Recommended textbooks for you
EBK CONTEMPORARY FINANCIAL MANAGEMENT
Finance
ISBN:
9781337514835
Author:
MOYER
Publisher:
CENGAGE LEARNING - CONSIGNMENT

Essentials of Business Analytics (MindTap Course …
Statistics
ISBN:
9781305627734
Author:
Jeffrey D. Camm, James J. Cochran, Michael J. Fry, Jeffrey W. Ohlmann, David R. Anderson
Publisher:
Cengage Learning

Intermediate Financial Management (MindTap Course…
Finance
ISBN:
9781337395083
Author:
Eugene F. Brigham, Phillip R. Daves
Publisher:
Cengage Learning
EBK CONTEMPORARY FINANCIAL MANAGEMENT
Finance
ISBN:
9781337514835
Author:
MOYER
Publisher:
CENGAGE LEARNING - CONSIGNMENT
Essentials of Business Analytics (MindTap Course …
Statistics
ISBN:
9781305627734
Author:
Jeffrey D. Camm, James J. Cochran, Michael J. Fry, Jeffrey W. Ohlmann, David R. Anderson
Publisher:
Cengage Learning
Intermediate Financial Management (MindTap Course…
Finance
ISBN:
9781337395083
Author:
Eugene F. Brigham, Phillip R. Daves
Publisher:
Cengage Learning


