Refer to Table 2. Interpret the first quartile that you calculate from question 14. at least 25 percent of the observations are less than 5. at least 25 percent of the observations are 5 or less. at least 25 percent of the observations are 5 or more. at least 25 percent of the observations are more than 5.
Refer to Table 2. Interpret the first quartile that you calculate from question 14. at least 25 percent of the observations are less than 5. at least 25 percent of the observations are 5 or less. at least 25 percent of the observations are 5 or more. at least 25 percent of the observations are more than 5.

Glencoe Algebra 1, Student Edition, 9780079039897, 0079039898, 2018
18th Edition
ISBN:9780079039897
Author:Carter
Publisher:Carter
Chapter10: Statistics
Section10.6: Summarizing Categorical Data
Problem 23PPS

Related questions
Question
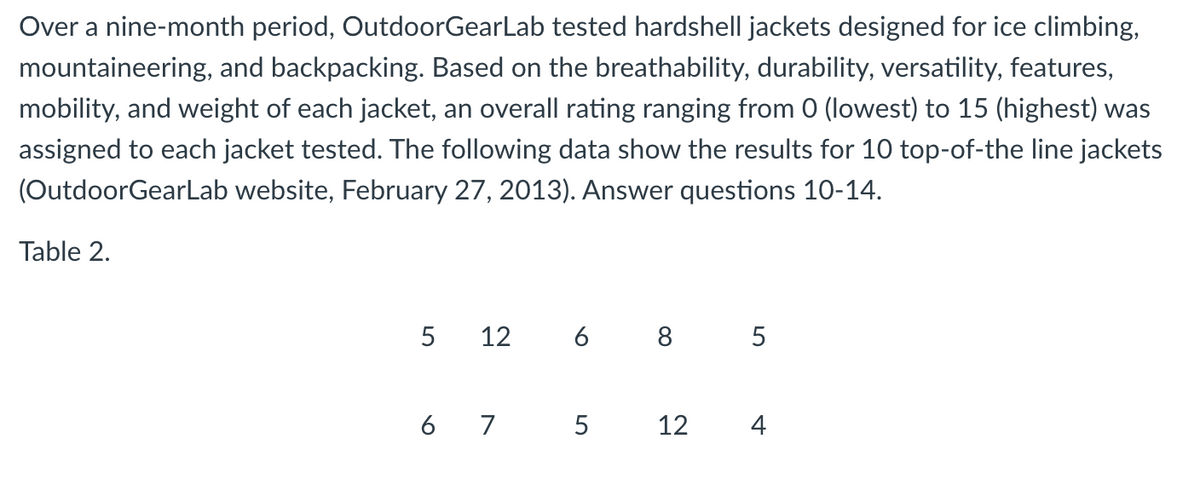
Transcribed Image Text:Over a nine-month period, OutdoorGearLab tested hardshell jackets designed for ice climbing,
mountaineering, and backpacking. Based on the breathability, durability, versatility, features,
mobility, and weight of each jacket, an overall rating ranging from O (lowest) to 15 (highest) was
assigned to each jacket tested. The following data show the results for 10 top-of-the line jackets
(OutdoorGearLab website, February 27, 2013). Answer questions 10-14.
Table 2.
5
12
6 8 5
6 7 5
12
4
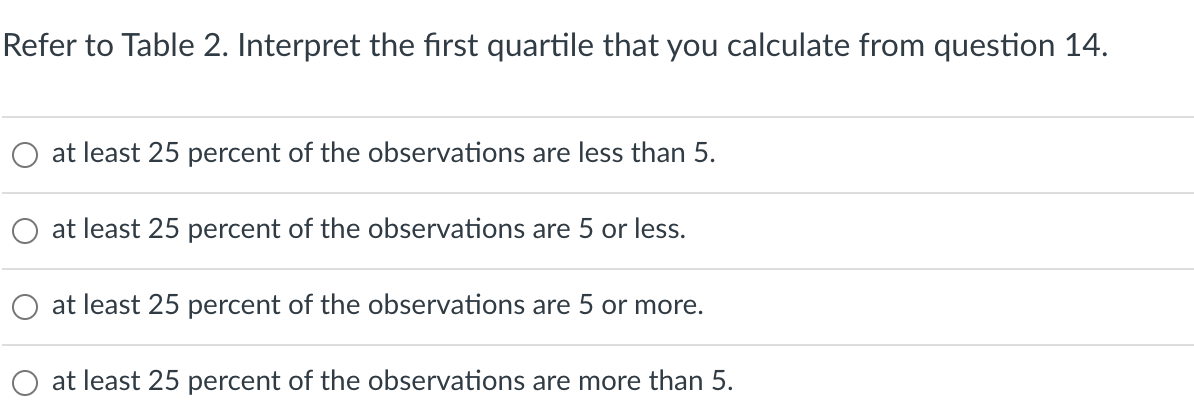
Transcribed Image Text:Refer to Table 2. Interpret the first quartile that you calculate from question 14.
at least 25 percent of the observations are less than 5.
at least 25 percent of the observations are 5 or less.
at least 25 percent of the observations are 5 or more.
at least 25 percent of the observations are more than 5.
Expert Solution
Step 1
The following data is given:
5, 12, 6, 8, 5, 6, 7, 5, 12, 4.

Trending now
This is a popular solution!

Step by step
Solved in 2 steps

Recommended textbooks for you
Glencoe Algebra 1, Student Edition, 9780079039897…
Algebra
ISBN:
9780079039897
Author:
Carter
Publisher:
McGraw Hill
Glencoe Algebra 1, Student Edition, 9780079039897…
Algebra
ISBN:
9780079039897
Author:
Carter
Publisher:
McGraw Hill