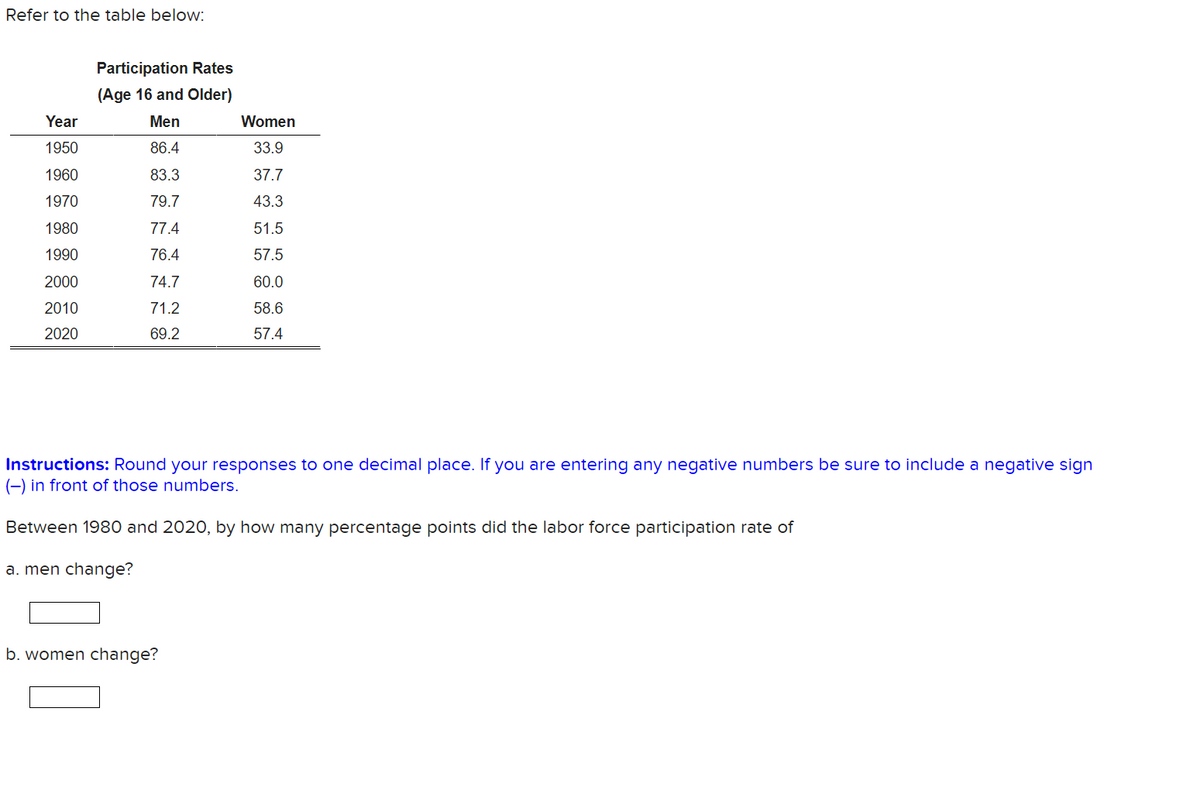
Refer to the table below: Year 1950 1960 1970 1980 1990 2000 2010 2020 Participation Rates (Age 16 and Older) Men 86.4 83.3 79.7 77.4 76.4 74.7 71.2 69.2 Women 33.9 37.7 43.3 51.5 57.5 60.0 58.6 57.4 Instructions: Round your responses to one decimal place. If you are entering any negative numbers be sure to include a negative sign (-) in front of those numbers. Between 1980 and 2020, by how many percentage points did the labor force participation rate of a. men change? b. women change?


Q: Consider the payoff matrix for a game depicted below. Player 1 selects the row and Player 2 selects…
A: Dominant strategy is the strategy where the strategy does not change with the change in opponent's…
Q: The following question has 5 parts (a.-e.), parts b. to e. will be revealed after submitting your…
A: In this case, we have to know the term steady state. Steady state situation indicates the situation…
Q: A small country imports T-shirts. With free trade at a world price of $10, domestic production is 10…
A: Introduction A free trade policy prohibits a government from favoring certain imports over others or…
Q: If the fixed costs are USD 100 000 and the variable cost can be expressed as VC(Q)=5Q² NOK where Q…
A: Fixed cost refers to the cost that does not change with change in level of output. Variable cost…
Q: Consider a prisoner's dilemma game shown below. In each cell, the number on the left is a payoff for…
A: *Hi there , as you have posted multiple questions following our guidelines we will solve the first…
Q: GIVEN INFORMATION: Think about Anteaterville's highly competitive smoothie market. Q is the…
A: ***Since the student has provided an incorrect demand function (Q = 1200p - 100p), hence, the expert…
Q: The monthly demand of a company is showed below, please use the static method to forecast the…
A: Forecast demand refers to an estimate of the amount of a product or service that is expected to be…
Q: Government-imposed taxes cause reductions in the activity that is being taxed, which has important…
A: Equilibrium in the market occurs where quantity demanded is equal to quantity supplied.
Q: The Impact of the Russian/Ukrainian war on the future of oil prices. Describe the future…
A: The Russian/Ukrainian war is an ongoing conflict that began in 2014, following the annexation of…
Q: Consider the demand curve illustrated in the figure to the right. Is demand elastic or inelastic? A.…
A: Price elasticity of demand: It measures the percentage change in the quantity demanded for a 1%…
Q: 1. a) p=. Consider the following game: q= Player 1 Top Bottom Left 3 7 6 0 Player 2 Right This game…
A: Mixed strategy Nash equilibrium: Under the mixed strategy Nash equilibrium at least one player has…
Q: QUESTION 5 (Q005) Which of the following countries ranks lowest (HIGHEST in gender inequality) on…
A: The term "gender inequality" describes how people are not treated equally based on their gender,…
Q: All of the following statements are true, except: Select the correct answer below: Many countries in…
A: Introduction The pace of price growth over a specific time period is referred to as inflation.…
Q: Explain using the real life examples. Public goods are free of cost.
A: Public goods are products or services that are both non-excludable and non-rivalrous in consumption,…
Q: Inc lass Excercise Савствање PPW = ? 5000 PW=? 5000t (2) 1 Soool (3) Son 2 Pw=n G 9=7%, i=15% 7 500…
A: The Present Worth Analysis is one of the techniques used to assess the project options. The worth of…
Q: 100 90 80 70 60 50 40 1. Plot and graph the data on the supply curve. P 50.00 60.00 70.00 80.00…
A: The demand curve shows the quantities of a commodity that buyers will be willing and able to…
Q: 6-10F Fill in the blanks in the figure below: a. c. b. f. & h C. d. Price and marginal revenue (in…
A: "Since you have posted a question with multiple sub-parts, we will solve the first three sub-parts…
Q: Given the following total-revenue and total-cost functions of a firm: TR = 4Q TC = 0.04Q³ – 0.9Q² +…
A: Profit is the difference between the total revenue and total cost. Total profit is maximum where…
Q: A company's debt ratio doubles from 0.75 to 1.5. How much does the debt ratio increase, i.e. what is…
A: The debt ratio for a certain firm displays whether or not it has loans and, if so, how its credit…
Q: Under a monopoly, demonstrate with with a demand curve, marginal revenue curve, and cost curve why a…
A: A market form where a single firm dominates the entire market for a particular product or service,…
Q: Total cost is 1200.output is 20.fixed cost is 1000.what is variable cost?
A: The concept of total cost is used in practically all business units. The main advantage of using the…
Q: Explain how the Solow growth model differs from models of endogenous growth with respect to the…
A: The Solow growth model and endogenous growth models differ in their treatment of technological…
Q: Using Incremental with EUAW analysis find the best alternative, MARR = %10. should use Excel and…
A: MARR = 10% Data points are as follows -
Q: Jevonte is saving money. Jevonte started with $21 and added $17.50 every week. Find the rate of…
A: You can escape life's uncertainties by saving money, which also gives you the chance to live a…
Q: what happens the unemployment when the discount rate increases
A: The Fed increases the discount rate when it wants other interest rates to increase. This is known as…
Q: Do firms have the right to drug test all job applicants and refuse to hire applicants who test…
A: A firm is a type of business entity that produces, distributes, or sells goods or services, such as…
Q: Would an increase in yuan in exchange for the dollar be good news or bad news for U.S. firms such as…
A: The exchange rate is the value of one currency in relation to another. It speaks of how quickly one…
Q: The Energy Information Administration's forecast that world crude oil demand will likely outpace…
A: The demand curve is the graphical representation of the relationship between the quantity demanded…
Q: a. What is the real per capita GDP for each country in 1970. AGO: Number DMA: Number b. What is the…
A: Given that: real per capita GDP data for the two countries. AGO and DMA are the country codes. (a)…
Q: Assume $60,000 is going to be invested in each of the following assets, using table 12-11 and table…
A: Answer:- (A). Assets:- Office furniture Category:- 7 - Year MARCS Cost of Asset(A) :-…
Q: A 6 times-interest-earned ratio is considered acceptable. Question 11 options: 1) True 2)…
A: In economics and finance, interest earned ratio or interest coverage ratio refers to the ratio that…
Q: Which of the following is included in the economist's definition of investment? the purchase of new…
A: Definition of investment in economics differs from the definition of investment in general.…
Q: The table shows the quantities of the goods Suzie bought and the prices she paid during two…
A: Since the instructed questions require solving of all the questions, we will be solving all the…
Q: to calculate the inflation rate since the previous period. (Round to two decimals. List the answers…
A: Inflation rate is the rate at which the price level increases over the period of time. Inflation…
Q: In economics term, define what money is
A: Natural objects were among the first forms of currency. Cowrie shells, for example, have been used…
Q: A man invests P 20,000 now for the college education of his 2 year old son. If the fund earns 10%…
A: It is given that the investment is made when the son age was 2 years so first it is required to find…
Q: A movement along the demand curve, represented by points A and B, is shown in the diagram to the…
A: Price elasticity of demand measures the responsiveness of change in quantity demand to change in…
Q: An increase in short-run aggregate supply means A) the real GDP would increase and rises in the…
A: Introduction ; Aggregate demand (AD) refers to the total amount of goods and services that all…
Q: Use a revealed preference argument to show that a per unit tax imposed on a monopoly causes the…
A: Per unit tax on a monopoly would imply : Taking original marginal cost as 'MC' & after tax…
Q: Randy Ratpack hates studying both economics and history. The more time he spends studying either…
A: An indifference curve is a graphical representation of a consumer's preferences for two goods or…
Q: 4) a Suppose there is a decrease in consumer optimism about the future (often called a decrease in…
A: IS-LM (Investment-Saving , Liquidity preference money supply) model shows us simultaneous…
Q: If 3 mangoes are sold for P^(75), how many mangoes can be bought for P^(150)?
A: Selling price of mangoes refers to the price that a consumers pays for purchasing the mangoes.…
Q: If you write a cheque on a bank in Saskatoon to purchase a new Nissan Murano, you are employing…
A: Money is one of the most important medium to buy goods and services, pay expenses and debts, etc.…
Q: Given a linear supply function of the form Q = -10 + 5Px, find the invers function. Select one or…
A: Supply curve shows a positive relationship between price and quantity supplied. It slopes upward for…
Q: You can afford a $350 per month car payment. You've found a 3 year loan at 6% interest. How big of a…
A: Monthly payment that can be affordable is equal to $350 So A=350 The rate of interest is 6% per…
Q: When the price of a trampoline was $636, the quantity demanded was 710 trampolines per month. Later,…
A: Given information: When the price of a trampoline was $636, the quantity demanded was 710…
Q: 1. Suppose coffee and cream are complements. How would an increase in the price of cream affect the…
A: If coffee and cream are complement goods, it means that consumer consumes both the goods together in…
Q: Question #4 - Use the aggregate expenditures model to demonstrate the multiplier effect
A: Introduction The multiplier is the amount by which we multiply a preliminary shift in aggregate…
Q: Cartoon Analysis: What message does this cartoon deliver about the struggle of identifying needs…
A: Needs and wants are two different categories of goods and services that we consume in our daily…
Q: A monopolist is producing at a point at which marginal cost exceeds marginal revenue. How should it…
A: A monopolist is a firm that has either a natural or legal monopoly in the market in which it…


Trending now
This is a popular solution!

Step by step
Solved in 3 steps

- What is difference between cohort analysis and cluster analysis. With exampleIn 2017-18, the Pakistan Bureau of Statistics announced that of all adult Pakistanis, 59,786,200 were employed, 3,613,800 were unemployed, and 58,800,000 were not in the labor force. Use this information to calculate the adult population.The following is a report from a BLS survey taker: “There were 90 people in the houses I visited. 20 of them were children under the age of 16, 25 people had full-time jobs, and 10 had part-time jobs. There were 10 retirees, 5 full-time homemakers, 9 full-time students over age 16, and 3 people who were disabled and cannot work. The remaining people did not have jobs, but all said they would like one. Five of these people had not looked actively for work for three months, however.” Find the labor force, the working-age population, the number of employed workers, and the number of unemployed workers.Instructions: Enter your responses as whole numbers.Labor force: peopleWorking-age population: peopleNumber of employed workers: peopleNumber of unemployed workers: people
- The following is a report from a BLS survey taker: “There were 70 people in the houses I visited. 12 of them were children under the age of 16, 25 people had full-time jobs, and 6 had part-time jobs. There were 10 retirees, 5 full-time homemakers, 5 full-time students over age 16, and 2 people who were disabled and cannot work. The remaining people did not have jobs, but all said they would like one. One of these people had not looked actively for work for three months, however.” Find the labor force, the working-age population, the number of employed workers, and the number of unemployed workers.Instructions: Enter your responses as whole numbers.Labor force: peopleWorking-age population: peopleNumber of employed workers: peopleNumber of unemployed workers: peopleThe following is a report from a BLS survey taker: There were 90 people in the houses I visited. 20 of them were children under the age of 16, 25 people had full-time jobs, and 10 had part-time jobs. There were 10 retirees, 5 full-time homemakers, 9 full-time students over age 16, and 3 people who were disabled and cannot work. The remaining people did not have jobs, but all said they would like one. 5 of these people had not looked actively for work for three months, however. Find the labor force, the unemployment rate, and the participation rate implied by the survey taker’s report.Labor force: people Instructions: Enter your responses rounded to two decimal places. Unemployment rate: %Participation rate: %Plz give a detailed answer
- Average Earnings by Innnigrant Cohort 2010 2010 2015 2015 Cohort Label YSM Earnings (S) YSM Earnings ($) Native-born Native N/A 73,915 N/A 80,245 1955-1959 1M5559 52.5 97,361 57.5 97,212 1960-1964 1M6064 47.5 91,822 52.5 93,156 1965-1969 1M6569 42.5 88,610 47.5 106,552 1970-1974 1M7074 37.5 88,392 42.5 93,163 1975-1979 1M7579 32.5 85,919 37.5 97,756 1980-1984 1M8084 27.5 79,911 32.5 81,500 1985-1989 1M8589 22.5 70,143 27.5 78,100 1990-1994 1M9094 17.5 64,342 22.5 69,033 1995-1999 1M9599 12.5 68,821 17.5 73,976 2000-2004 IM0004 7.5 66,971 12.5 74,907 2005-2009 IM0509 2.5 58,623 7.5 67,780 2010-2014 IM1014 2.5 60,596 NOTE: "YSM" refers to the average years since migration. This is a table of average earnings for various immigration cohorts as well as native-born Canadians for 2010 and 2015. These values are expressed in 2015 real dollars. A) Calculate the cross-sectional entry effect for the IM0509 cohort. Interpret what the number…Cumulative % of Population 0 20 40 60 80 100 Cumulative % of Income, United States, 2010 0 5 15 29 49 100 Cumulative % of Income, Argentina, 2010 0 4 13 28 50 100 Report your answers to two decimal places. According to these data, the Gini coefficient for the United States in 2010 is _______ The Gini coefficient for Argentina in 2010 is ______ These data indicate that in 2010, income is (blank) in the United States compared to Argentina.Suppose a researcher is using a panel data set on n = 10,000 workers over T = 20 years (from 2000 through 2019) that contains the workers’ earnings, sex, education, and age. The researcher is interested in the effect of education on earnings. Give some examples of unobserved person-specific variables that are correlated with both education and earnings. Can you think of examples of time-specific variables that might be correlated with education and earnings? How would you control for these person-specific and time-specific effects in a panel data regression?