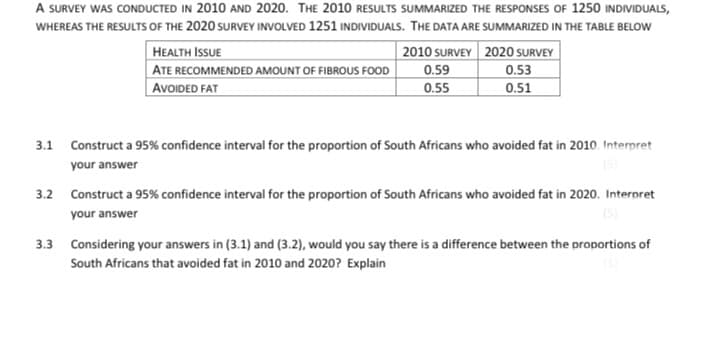
A SURVEY WAS CONDUCTED IN 2010 AND 2020. THE 2010 RESULTS SUMMARIZED THE RESPONSES OF 1250 INDIVIDUALS, WHEREAS THE RESULTS OF THE 2020 SURVEY INVOLVED 1251 INDIVIDUALS. THE DATA ARE SUMMARIZED IN THE TABLE BELOW 2010 SURVEY 2020 SURVEY 0.59 0.53 0.55 0.51 HEALTH ISSUE ATE RECOMMENDED AMOUNT OF FIBROUS FOOD AVOIDED FAT 3.1 Construct a 95% confidence interval for the proportion of South Africans who avoided fat in 2010. Interpret your answer 3.2 Construct a 95% confidence interval for the proportion of South Africans who avoided fat in 2020. Interpret your answer (5) 3.3 Considering your answers in (3.1) and (3.2), would you say there is a difference between the proportions of South Africans that avoided fat in 2010 and 2020? Explain
A SURVEY WAS CONDUCTED IN 2010 AND 2020. THE 2010 RESULTS SUMMARIZED THE RESPONSES OF 1250 INDIVIDUALS, WHEREAS THE RESULTS OF THE 2020 SURVEY INVOLVED 1251 INDIVIDUALS. THE DATA ARE SUMMARIZED IN THE TABLE BELOW 2010 SURVEY 2020 SURVEY 0.59 0.53 0.55 0.51 HEALTH ISSUE ATE RECOMMENDED AMOUNT OF FIBROUS FOOD AVOIDED FAT 3.1 Construct a 95% confidence interval for the proportion of South Africans who avoided fat in 2010. Interpret your answer 3.2 Construct a 95% confidence interval for the proportion of South Africans who avoided fat in 2020. Interpret your answer (5) 3.3 Considering your answers in (3.1) and (3.2), would you say there is a difference between the proportions of South Africans that avoided fat in 2010 and 2020? Explain

Glencoe Algebra 1, Student Edition, 9780079039897, 0079039898, 2018
18th Edition
ISBN:9780079039897
Author:Carter
Publisher:Carter
Chapter10: Statistics
Section10.3: Measures Of Spread
Problem 1GP

Related questions
Question
Transcribed Image Text:A SURVEY WAS CONDUCTED IN 2010 AND 2020. THE 2010 RESULTS SUMMARIZED THE RESPONSES OF 1250 INDIVIDUALS,
WHEREAS THE RESULTS OF THE 2020 SURVEY INVOLVED 1251 INDIVIDUALS. THE DATA ARE SUMMARIZED IN THE TABLE BELOW
2010 SURVEY 2020 SURVEY
0.59
0.53
0.55
0.51
HEALTH ISSUE
ATE RECOMMENDED AMOUNT OF FIBROUS FOOD
AVOIDED FAT
3.1 Construct a 95% confidence interval for the proportion of South Africans who avoided fat in 2010. Interpret
your answer
3.2 Construct a 95% confidence interval for the proportion of South Africans who avoided fat in 2020. Interpret
your answer
(5)
3.3 Considering your answers in (3.1) and (3.2), would you say there is a difference between the proportions of
South Africans that avoided fat in 2010 and 2020? Explain
Expert Solution
This question has been solved!
Explore an expertly crafted, step-by-step solution for a thorough understanding of key concepts.

Step by step
Solved in 4 steps with 1 images

Recommended textbooks for you
Glencoe Algebra 1, Student Edition, 9780079039897…
Algebra
ISBN:
9780079039897
Author:
Carter
Publisher:
McGraw Hill

College Algebra (MindTap Course List)
Algebra
ISBN:
9781305652231
Author:
R. David Gustafson, Jeff Hughes
Publisher:
Cengage Learning
Glencoe Algebra 1, Student Edition, 9780079039897…
Algebra
ISBN:
9780079039897
Author:
Carter
Publisher:
McGraw Hill
College Algebra (MindTap Course List)
Algebra
ISBN:
9781305652231
Author:
R. David Gustafson, Jeff Hughes
Publisher:
Cengage Learning