Researchers were interested in play types. Children in 3 age groups were compared. The researchers measured the number of minutes out of a 30 minute time san $% significance level (a = 0.05). What conclusion can the researchers draw? Interpret the Post Hoc tests using the Bonferroni procedure. Write the step 5 answer ( Toddler Preschool Kindergarten Anova: Single Factor 20 24 SUMMARY Groups Toddler 14 18 Count Sum Average Varionce 3 18 21 21 5.25 2.916667 22 Preschool 48 12 24.66667 Kindergarten 105 21 ANOVA Source of Variation Between Groups Within Groups MS Pvalue Ferit 2 281.1635 27.36384 0.000088 4.102821 10 10.275 562.320 102.75 Total 665.0769 12 t-Test: Two-Sample Assuming Egual Variances -Test: Two-Sample Assuming Equal Variances -Test: Two-Sample Assuming Equal Variances Toddler Preschool 5.25 Toddler Kindergarten Preschool Kindergarten Mean 12 Mean 5.25 21 Mean 12 21 Variance Observations Pooled Variance 2.917 24.667 Variance 2.917 Variance 24.667 4 Observations Observations 13.792 Pooled Variance 4.107 Pooled Variance 13.429 Hypothesized Mean Difference df Hypothesized Mean Difference Hypothesized Mean Difference df df t Stat 2.570 t Stat 11.585 t Stat 3.661 P(Teat) one-tail t Critical one-tail P(Tent) two tail t Critical two-tail 0.021 P(Tent) one-tail 0.000004 P(Teit) one tail 0.004 t Critical one-tail P(Tet) two tail t Critical two-tail 1943 1895 tCritical one tail 1.895 0.000008 P(Tet) two tail t Critical two-tail 0.042 0.008 2.447 2.365 2.365
Researchers were interested in play types. Children in 3 age groups were compared. The researchers measured the number of minutes out of a 30 minute time san $% significance level (a = 0.05). What conclusion can the researchers draw? Interpret the Post Hoc tests using the Bonferroni procedure. Write the step 5 answer ( Toddler Preschool Kindergarten Anova: Single Factor 20 24 SUMMARY Groups Toddler 14 18 Count Sum Average Varionce 3 18 21 21 5.25 2.916667 22 Preschool 48 12 24.66667 Kindergarten 105 21 ANOVA Source of Variation Between Groups Within Groups MS Pvalue Ferit 2 281.1635 27.36384 0.000088 4.102821 10 10.275 562.320 102.75 Total 665.0769 12 t-Test: Two-Sample Assuming Egual Variances -Test: Two-Sample Assuming Equal Variances -Test: Two-Sample Assuming Equal Variances Toddler Preschool 5.25 Toddler Kindergarten Preschool Kindergarten Mean 12 Mean 5.25 21 Mean 12 21 Variance Observations Pooled Variance 2.917 24.667 Variance 2.917 Variance 24.667 4 Observations Observations 13.792 Pooled Variance 4.107 Pooled Variance 13.429 Hypothesized Mean Difference df Hypothesized Mean Difference Hypothesized Mean Difference df df t Stat 2.570 t Stat 11.585 t Stat 3.661 P(Teat) one-tail t Critical one-tail P(Tent) two tail t Critical two-tail 0.021 P(Tent) one-tail 0.000004 P(Teit) one tail 0.004 t Critical one-tail P(Tet) two tail t Critical two-tail 1943 1895 tCritical one tail 1.895 0.000008 P(Tet) two tail t Critical two-tail 0.042 0.008 2.447 2.365 2.365

Glencoe Algebra 1, Student Edition, 9780079039897, 0079039898, 2018
18th Edition
ISBN:9780079039897
Author:Carter
Publisher:Carter
Chapter10: Statistics
Section10.6: Summarizing Categorical Data
Problem 30PPS

Related questions
Question
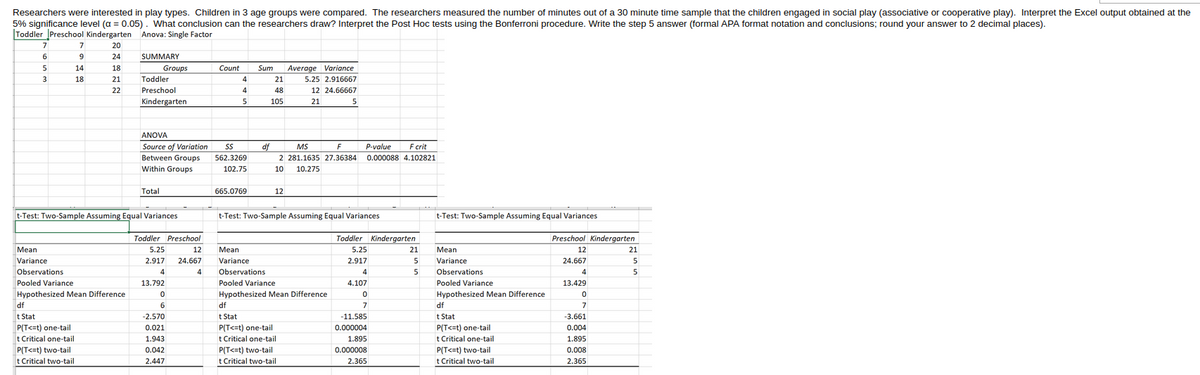
Transcribed Image Text:Researchers were interested in play types. Children in 3 age groups were compared. The researchers measured the number of minutes out of a 30 minute time sample that the children engaged in social play (associative or cooperative play). Interpret the Excel output obtained at the
5% significance level (a = 0.05). What conclusion can the researchers draw? Interpret the Post Hoc tests using the Bonferroni procedure. Write the step 5 answer (formal APA format notation and conclusions; round your answer to 2 decimal places).
Toddler Preschool Kindergarten Anova: Single Factor
%3D
7
7
20
6
9
24
SUMMARY
Groups
Toddler
5
14
18
Count
Sum
Average Variance
18
21
4
21
5.25 2.916667
22
Preschool
4
48
12 24.66667
Kindergarten
5
105
21
5
ANOVA
Source of Variation
df
MS
F
P-value
F crit
Between Groups
562.3269
2 281.1635 27.36384 0.000088 4.102821
Within Groups
102.75
10
10.275
Total
665.0769
12
t-Test: Two-Sample Assuming Equal Variances
t-Test: Two-Sample Assuming Equal Variances
t-Test: Two-Sample Assuming Equal Variances
Toddler Preschool
Toddler Kindergarten
Preschool Kindergarten
Мean
5.25
12
Мean
5.25
21
Мean
12
21
2.917
24.667
Variance
2.917
Variance
Observations
Variance
24.667
5
Observations
4
4
Observations
5
4
Pooled Variance
13.792
Pooled Variance
4.107
Pooled Variance
13.429
Hypothesized Mean Difference
Hypothesized Mean Difference
Hypothesized Mean Difference
df
6
df
7
df
7
t Stat
-2.570
t Stat
-11.585
t Stat
-3.661
P(T<=t) one-tail
t Critical one-tail
P(T<=t) two-tail
t Critical two-tail
P(T<=t) one-tail
t Critical one-tail
P(T<=t) two-tail
t Critical two-tail
0.021
P(T<=t) one-tail
t Critical one-tail
P(T<=t) two-tail
t Critical two-tail
0.000004
0.004
1.943
0.042
1.895
1.895
0.000008
0.008
2.447
2.365
2.365
Expert Solution
This question has been solved!
Explore an expertly crafted, step-by-step solution for a thorough understanding of key concepts.

Step by step
Solved in 2 steps

Recommended textbooks for you
Glencoe Algebra 1, Student Edition, 9780079039897…
Algebra
ISBN:
9780079039897
Author:
Carter
Publisher:
McGraw Hill

College Algebra (MindTap Course List)
Algebra
ISBN:
9781305652231
Author:
R. David Gustafson, Jeff Hughes
Publisher:
Cengage Learning
Glencoe Algebra 1, Student Edition, 9780079039897…
Algebra
ISBN:
9780079039897
Author:
Carter
Publisher:
McGraw Hill
College Algebra (MindTap Course List)
Algebra
ISBN:
9781305652231
Author:
R. David Gustafson, Jeff Hughes
Publisher:
Cengage Learning