The 95% confidence interval is from hour(s) to hour(s). (Round to two decimal places as needed.) Interpret the 95% confidence interval. Select all that apply. O A. With 95% confidence, the mean amount of time spent per day on digital media last year by all adults in the region is between the interval's bounds. B. 95% of all adults in the region spent amounts of time per day on digital media last year that are between the interval's bounds. C. There is a 95% chance that tfe mean amount of time spent per day on digital media last year by all adults in the region is between the interval's bounds. ID. 95% of all possible random samples of 20 adults in the region have mean amounts of time spent per day on digital media last year that are between the interval's bounds.
The 95% confidence interval is from hour(s) to hour(s). (Round to two decimal places as needed.) Interpret the 95% confidence interval. Select all that apply. O A. With 95% confidence, the mean amount of time spent per day on digital media last year by all adults in the region is between the interval's bounds. B. 95% of all adults in the region spent amounts of time per day on digital media last year that are between the interval's bounds. C. There is a 95% chance that tfe mean amount of time spent per day on digital media last year by all adults in the region is between the interval's bounds. ID. 95% of all possible random samples of 20 adults in the region have mean amounts of time spent per day on digital media last year that are between the interval's bounds.

MATLAB: An Introduction with Applications
6th Edition
ISBN:9781119256830
Author:Amos Gilat
Publisher:Amos Gilat
Chapter1: Starting With Matlab
Section: Chapter Questions
Problem 1P

Related questions
Question
Transcribed Image Text:12
1 234
50780
Shamere HoL
SS
age 1)
ar
t0.10
t0.05
(0.025
t0.005
Jp
Jp
1001
3.078
6.314
12.706
31.821
63.657
1.886 2.920
1.638 2.353 3.182
1.533 2.132 2.776
4.303
9.925
5.841
6.965
4.541
3.
3.747
4.604
4.
3.365
2.571
2.447
4.032
3.707
1.476 2.015
1.440 1.943
3.143
6.
8669
3.355
2.365
1.415
1.397 1.860
1.383 1.833
1.895
2.306
2.262
2.821
3.250
6.
1.372 1.812
2.228
2.764
3.169
10.
3.106
2.718
1.363 1.796
1.356 1.782
- 1.350 1.771
1.345 1.761 2.145
2.201
II
12
2.179
189
3.055
12
13
2.160
2.650
3.012
13
14
2.624
14
1.341 1.753
1.337. 1.746 2.120
1.333 1.740
2.947
2.602
"2.583
2.567
-2552
15
2.131
15
2.921
91
17
91
2.110
868
18
1.330 1.734
2878
18
TOI
Print
Done
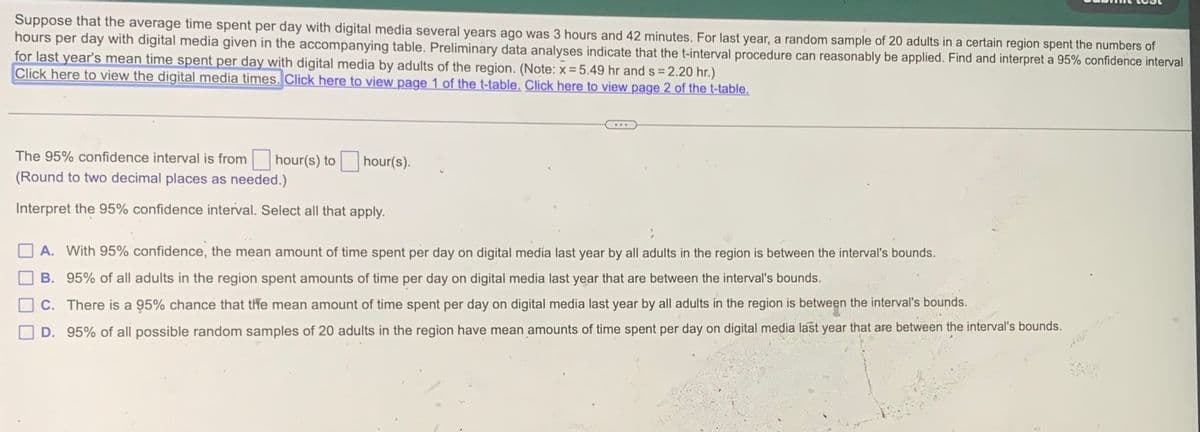
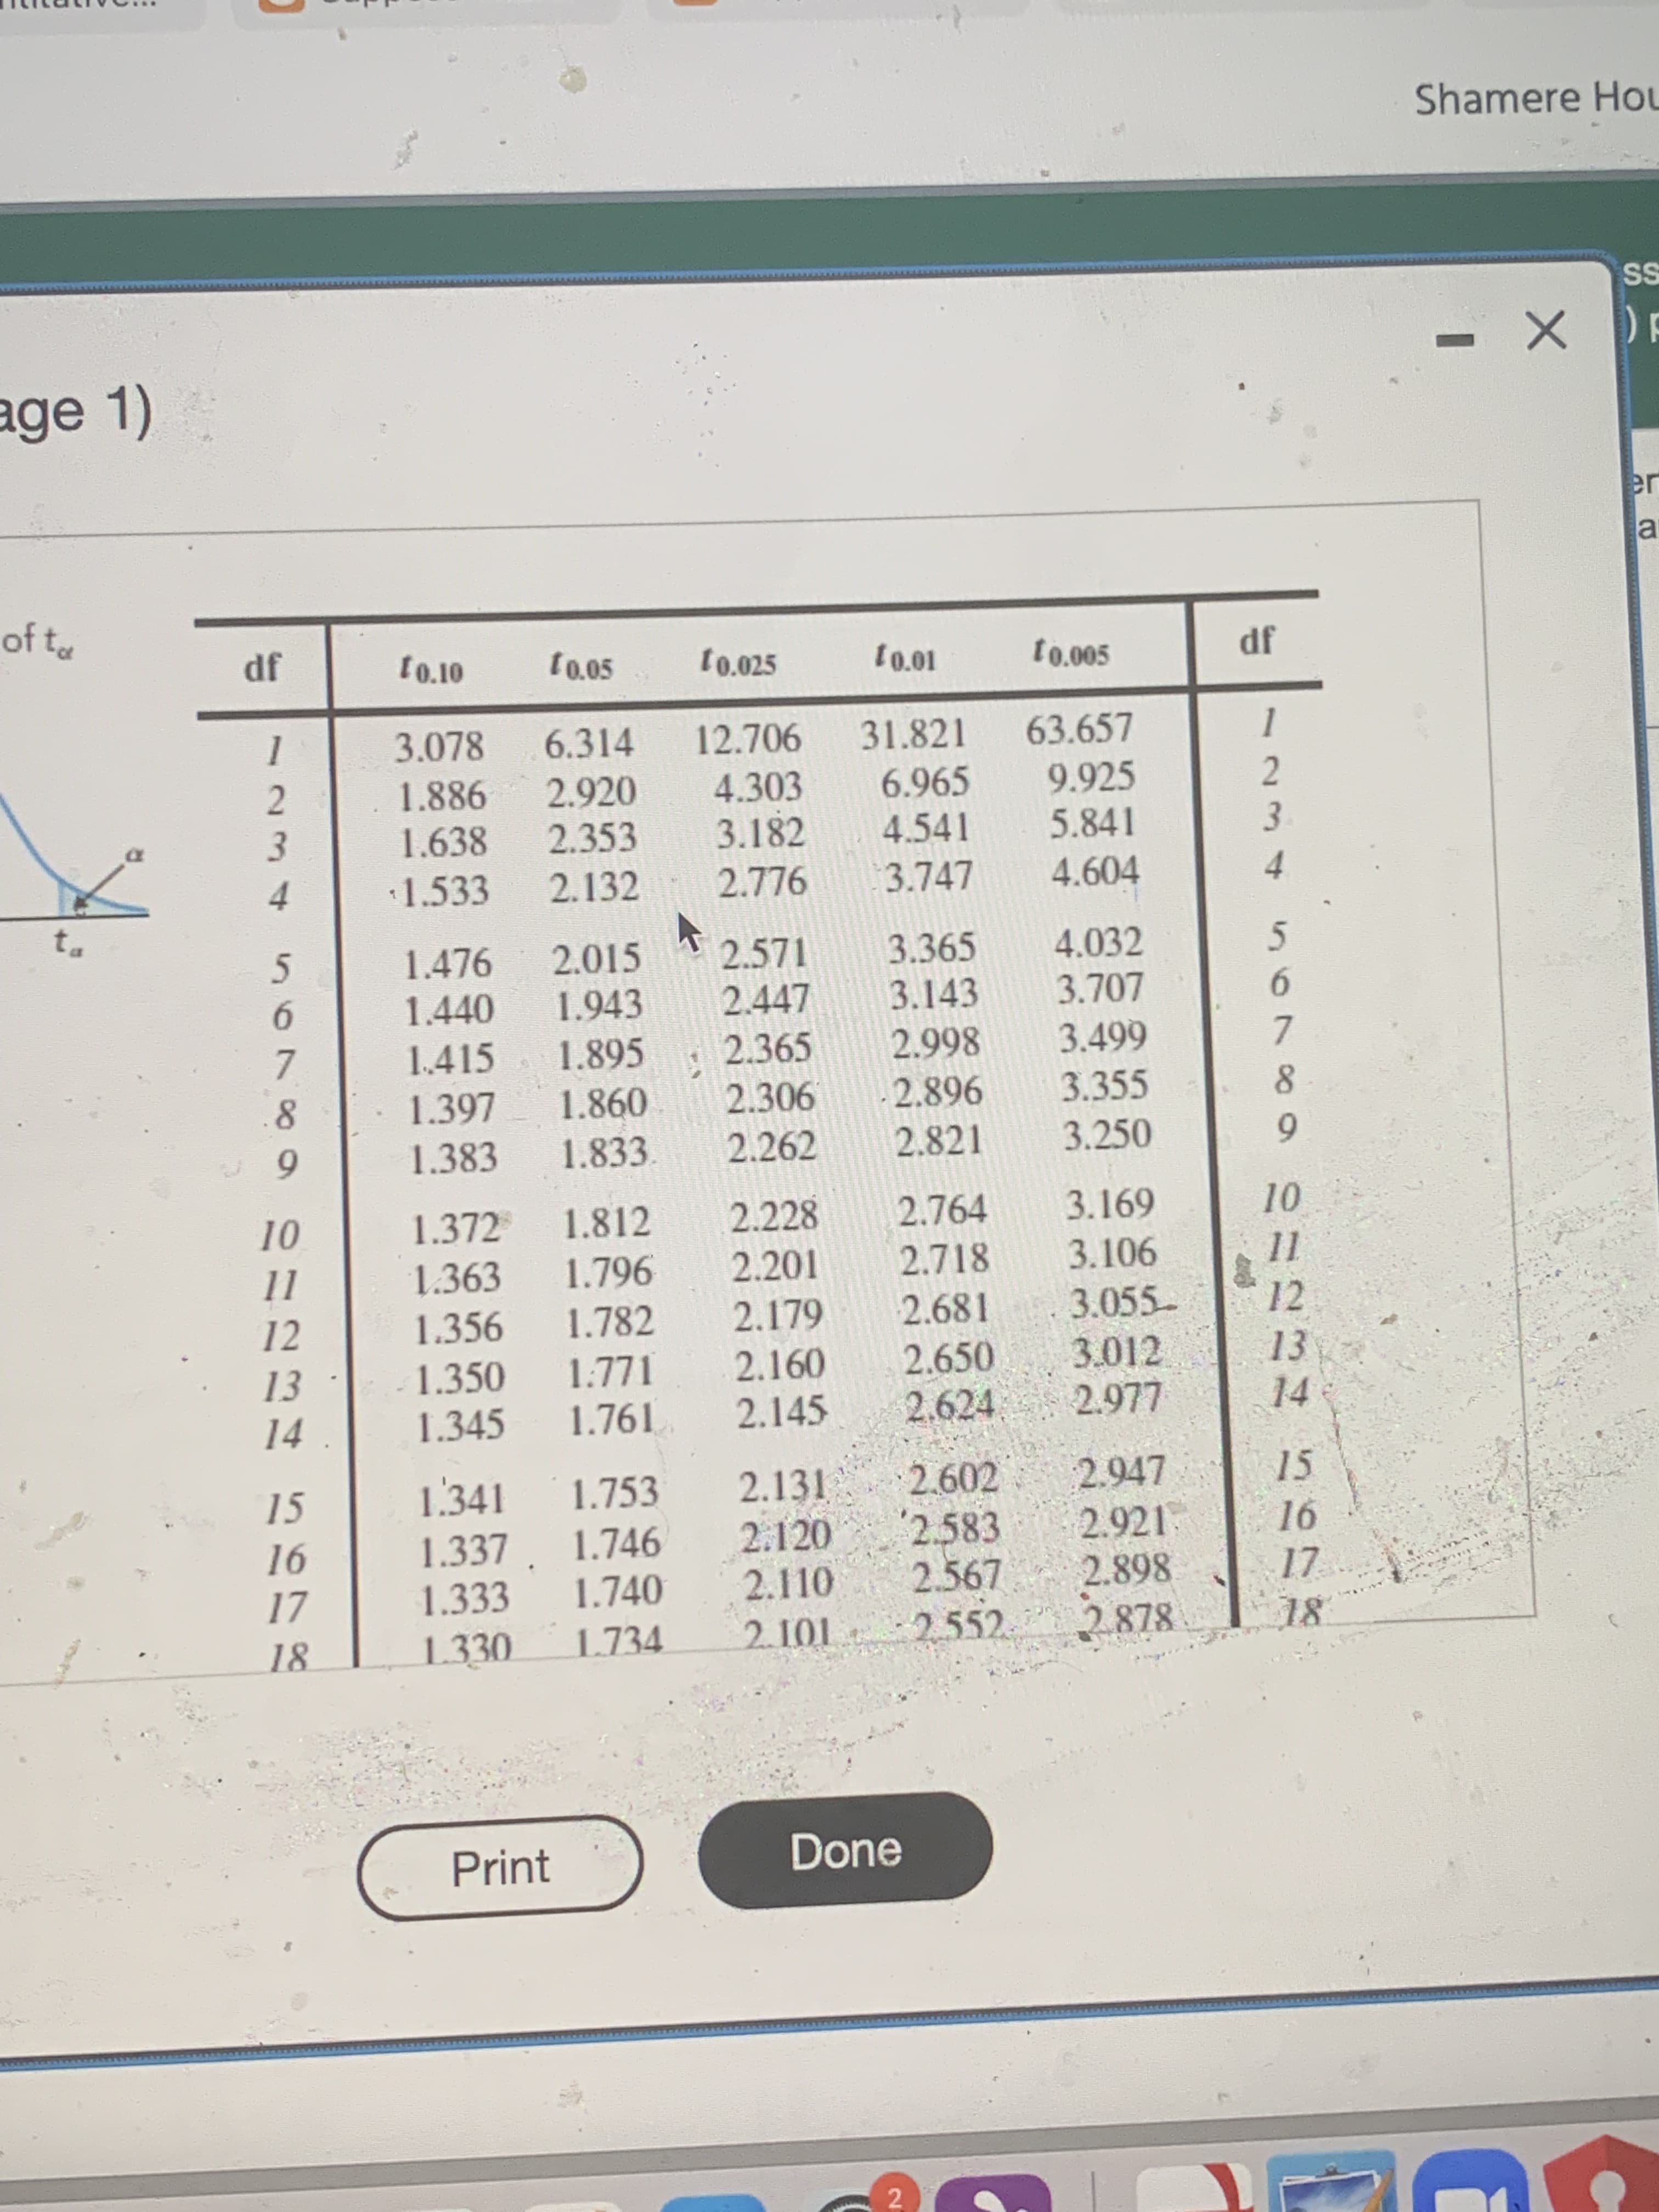
Transcribed Image Text:Suppose that the average time spent per day with digital media several years ago was 3 hours and 42 minutes. For last year, a random sample of 20 adults in a certain region spent the numbers of
hours per day with digital media given in the accompanying table. Preliminary data analyses indicate that the t-interval procedure can reasonably be applied. Find and interpret a 95% confidence interval
for last year's mean time spent per day with digital media by adults of the region. (Note: x = 5.49 hr and s = 2.20 hr.)
Click here to view the digital media times. Click here to view page 1 of the t-table. Click here to view page 2 of the t-table.
The 95% confidence interval is from hour(s) to
hour(s).
(Round to two decimal places as needed.)
Interpret the 95% confidence interval. Select all that apply.
A. With 95% confidence, the mean amount of time spent per day on digital media last year by all adults in the region is between the interval's bounds.
B. 95% of all adults in the region spent amounts of time per day on digital media last year that are between the interval's bounds.
C. There is a 95% chance that tife mean amount of time spent per day on digital media last year by all adults in the region is between the interval's bounds.
D. 95% of all possible random samples of 20 adults in the region have mean amounts of time spent per day on digital media last year that are between the interval's bounds.
Expert Solution
This question has been solved!
Explore an expertly crafted, step-by-step solution for a thorough understanding of key concepts.

This is a popular solution!

Trending now
This is a popular solution!

Step by step
Solved in 2 steps with 2 images

Recommended textbooks for you
MATLAB: An Introduction with Applications
Statistics
ISBN:
9781119256830
Author:
Amos Gilat
Publisher:
John Wiley & Sons Inc

Probability and Statistics for Engineering and th…
Statistics
ISBN:
9781305251809
Author:
Jay L. Devore
Publisher:
Cengage Learning

Statistics for The Behavioral Sciences (MindTap C…
Statistics
ISBN:
9781305504912
Author:
Frederick J Gravetter, Larry B. Wallnau
Publisher:
Cengage Learning
MATLAB: An Introduction with Applications
Statistics
ISBN:
9781119256830
Author:
Amos Gilat
Publisher:
John Wiley & Sons Inc
Probability and Statistics for Engineering and th…
Statistics
ISBN:
9781305251809
Author:
Jay L. Devore
Publisher:
Cengage Learning
Statistics for The Behavioral Sciences (MindTap C…
Statistics
ISBN:
9781305504912
Author:
Frederick J Gravetter, Larry B. Wallnau
Publisher:
Cengage Learning

Elementary Statistics: Picturing the World (7th E…
Statistics
ISBN:
9780134683416
Author:
Ron Larson, Betsy Farber
Publisher:
PEARSON

The Basic Practice of Statistics
Statistics
ISBN:
9781319042578
Author:
David S. Moore, William I. Notz, Michael A. Fligner
Publisher:
W. H. Freeman

Introduction to the Practice of Statistics
Statistics
ISBN:
9781319013387
Author:
David S. Moore, George P. McCabe, Bruce A. Craig
Publisher:
W. H. Freeman