ride in a certain island. The table below shows the chlo 142 M (% of roadway area) y (chloride concentration mm/L 0.1900 0.7000 04700 4.4000 10.6000 118000
Q: It's true-sand dunes in Colorado rival sand dunes of the Great Sahara Desert! The highest dunes at…
A: Since you have asked multiple question, we will solve the first question for you. If you want any…
Q: Estimated statistics for the United States and Germany in 2018 United States Crude Mortality…
A: Given the estimated statistics of US and Germany. We need to explain the lower crude mortality rate…
Q: A research team wants to investigate whether happier individuals are more productive. They carry out…
A: a) Solution: This is a result of bias from omitted variables. We eliminated the comedy variable in…
Q: Use the normal distribution of SAT critical reading scores for which the mean is 501 and the…
A: Given that SAT critical scores are normally distributed. Mean (μ) = 501 Standard deviation (σ) =…
Q: How many apps? According to a website, the mean number of apps on a smartphone in the United States…
A: It is given that the mean is 86 and the standard deviation is 26.
Q: (a) What is the probability that one car chosen at random will have less than 66.5 tons of coal?…
A: It is given that Mean, μ = 67 Standard deviation, σ = 1.7 Sample size, n = 43 Z-Score, Z = ( X - μ…
Q: A recent study showed that the average number of sticks of gum a person chews in a week is 16. The…
A: From the provided information, Sample size (n) = 31 Sample mean (x̄) = 14 Population standard…
Q: If the you were given a set of measurements 9.5 g, 8.5 g,9,1 g, 9.3 g, and 9.1 g, What is the mean…
A:
Q: X₁ and X₂ are random samples from exp(). when x > 0.) (pdf of exp()=e Determine the constant c so…
A: we have given that Xi follow exponential with mean λ that is E(Xi) = λ also, X1 and X2 are…
Q: A recent publication states that the average closing cost for purchasing a new home is $8542. A real…
A: According to the given information in this question We need to apply T test for one population mean
Q: Find the proportion given n=39 and .X= 33 Group of answer choices A.0.15. B. 0.85 C. 0.46 D.…
A: Given data n=39 x=33
Q: An instructor recorded the following number of correct items (in a quiz with 10 questions) for the…
A: Here we had given that exam is multiple choice exam and the score is our variable. We had given 12…
Q: Using a standard six-sided die, Janice rolled either a 2 or 5 on the last 6 rolls of die. What's…
A: Solution Given That, Using a standard six-sided die, Janice rolled either a 2 or 5 on the last 6…
Q: n heart rate for healthy boys age 10 to 13 after walking on a treadmill at 2.6 km/hour - for 6…
A: GIVEN AS, To test the hypothesis by using t test.
Q: stry (busin is
A: The process of data classification can be into different categories to use for more efficient…
Q: If you pick a card at random from a well shuffled deck, what is the probability that you get a face…
A: Solution Given That, If you pick a card at random from a well shuffled deck, what is the…
Q: Suppose in a random sample of 126 individuals, 41 are considered success. Compute the margin of…
A: Given x=41, n=126
Q: You wish to test the following claim (HaHa) at a significance level of α=0.01α=0.01. For the context…
A: Given datapre-test post-test48.2 51.945…
Q: According to a study, 74% of K-12 schools or districts in a country use digital content such as…
A:
Q: In a study of a group of women science majors who remained in their profession and a group who left…
A: Given that x1 = 3.09 x2 = 2.92 σ1 = 0.78σ2 = 0.78 n1 = 107n2 = 222
Q: 8. Bliss (1935) reported the number of adult flour beetles killed after 5 hours of exposure to…
A: Given Information: Consider the given output.
Q: You are interested in finding a 98% confidence interval for the average number of days of class that…
A: Given,sample size(n)=13degrees of freedom(df)=n-1df=13-1=12α=1-0.98=0.02α2=0.01t0.01(12)=2.681…
Q: A nutritionist claims that the mean tuna consumption by a person is 3.5 pounds per year. A sample of…
A:
Q: Assume that when adults with smartphones are randomly selected, 41%use them in meetings or classes.…
A: From the provided information, Sample size (n) = 6 Assume that when adults with smartphones are…
Q: Vähäble x is the number in the group who say that they take one or more online courses. Determine…
A: The given data is x P(x) 0 0.106 1 0.359 2 0.393 3 0.142
Q: There are 84 players who play a chess game against the Computer. Each player plays 36 times and the…
A: The provided information is N=84 n=36 times p=0.55 Let Xi be the number of times player i wins X…
Q: Based on this information, what is the probability that an individual actually has Lyme disease…
A: Let us define some events A : an individual has Lyme disease. B : an individual does not have…
Q: Explain the Holt-Winter and Brown forecasting technique
A: Holt winter’s algorithm has wide areas of application. It is used in various business problems…
Q: The diameter of holes for a cable harness is known to have a normal distribution with o = 0.02…
A: The following information has been provided: The population standard deviation is σ=0.02. The sample…
Q: A study was conducted to investigate the interactions between California sheephead, macroalgae, and…
A: Direct effect = if there is not any intermediate. Indirect = if one intermediate is present Spurious…
Q: Assume that a randomly selected subject is given a bone density test. Those test scores are normally…
A: Assume that z is a random variable, which defines the bone density test score.
Q: The amount of time, in minutes, that a person must wait for a bus is uniformly distributed between…
A:
Q: Frequency distribution. The lower class limit of the class is A) 2m +1 (B) 2m 1 (C) m - 1 (D) m - 21
A: It is given that Mid point = m Upper limit = l Note: According to Bartleby expert guidelines, we…
Q: 1. Calculate the sample correlation coefficient r. r = ____. 2. Determine the critical value
A:
Q: How many students use RStudio only for data analysis? How many students use at least two software…
A:
Q: Analysis of a set of data for 193 countries reported in the cross-country analysis by Bulled and…
A: Correlation Correlation is the process of studying the effect and cause of the relationship…
Q: Determine the probability of 3 out of 5 people getting accepted into a graduate program, where the…
A: The question is about prob. dist. Given : Total no. of people ( n ) = 5 Prob. of selecting single…
Q: In a group of 5000 adults, 3500 are in favor of stricter gun control laws, 1200 are against such…
A:
Q: An instructor gives a 100 point examination in which the grades are normally distributed. hte mean…
A: Given:- The sample follows a normal distribution with a mean, μ =60, & a standard deviation, of…
Q: n order to estimate the average electric usage per month, a sample of 121 houses was selected and…
A:
Q: V (Round to two decimal places as needed.)
A: Given that x1¯ =2.36, x2¯ =2.67, μ1-μ2=0s1 =0.96, s2 =0.68, n1=30, n2=32
Q: What is the relation between Net Trade Credit and ROA (Dependent variable)? how it affects each…
A: Regression analysis
Q: For which of the following P-values will the null hypothesis be rejected when performing a test with…
A: Answer : - Given, significance level α = 0.05 For which of the following P-value…
Q: 1. The head of the production department of a RM Electronic Company wants to determine the…
A: Please note that as per our guidelines if multiple sub-parts are there in the question we can answer…
Q: -pound male ke to limit his
A: BAC (Blood Alcohol Content) : The percentage of alcohol in a individual's blood will be known as…
Q: Q: The mean of five numbers is 30. If one number is excluded, their mean becomes 28. Find the…
A: Note: As per my policy i can answer only one question. kindly repost another question. Given data…
Q: b) The test statistic value is (two decimal places): c) Using the P-value method, the P-value is (4…
A:
Q: amount of time, in minutes, that a person must wait for a bus is uniformly distributed between 10…
A: It is given that the The amount of time, in minutes, that a person must wait for a bus is uniformly…
Q: FRED 120 Barrel 115 110 - Crude Oil Prices: West Texas Intermediate (WTI)-Cushing, Oklahoma
A: Date Price of Oil 22-02-2022 92 24-02-2022 93 26-02-2022 91 28-02-2022 96 02-03-2022 111…
Q: Data collected by a psychology professor over a four-year period examined the relationship between…
A: a. Coefficiient of detrmination is the square of coefficient of correlation. Data collected by a…
Find a 90% confidence interval of mean chloride concentration when roadway area is 0.8%
write your solution clearly
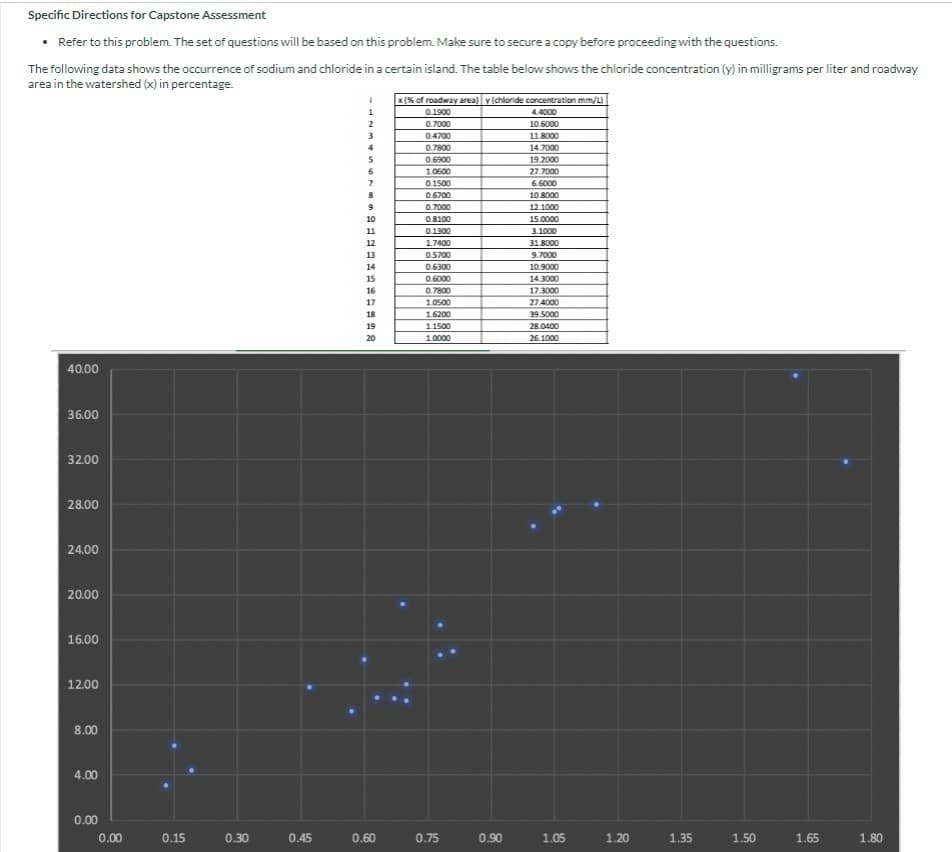
Step by step
Solved in 2 steps
- A diabetic person is interested in determining how the amount of aerobic exercise impacts his blood sugar. When blood sugar reaches 170 mg/dl, he goes out for a run at a pace of 10 minutes per mile. On different days, he runs different distances and measures his blood sugar after completing his run. The preferred blood sugar level is in the range of 80 to120 mg/dl. Levels that are too low or too high are extremely dangerous. The data generated are given in the following table: Distance (miles),x Blood sugar(mg/dl gram),y 2 136 2 146 2.5 131 2.5 125 3 120 3 116 3.5 104 3.5 95 4 85 4 94 4.5 83 4.5 75 Based on the scenario above, analyse the data with appropriate statistical methods and describe your findings in details. Use alpha=0.05 [note: use hypothesis, test statistics confidence interval etc.] ]What type of analysis and descriptive statistics should be conducted to best depict the relationship between the following variables? Also, specify the type of variable in each question ( such as nominal, ordinal, continuous, etc) and which is the independent and dependent variable in each question. the association between the number of hours in the operating room and the number of hours on a bypass pump? the relationship between the number of days in the ICU and gender?Identify the category of data, type of quantitative data* and scale of measurement of the given variables. (*please answer NOT APPLICABLE if your answer is qualitative) Variable Category of Data Type of Quantitative Scale of Measurement Anemia Status 11. 14. 17. Socioeconomic Status 12. 15. 18. Educational Attainment 13. 16. 19. Identify the type of code appropriate for the given variable: Age group Blood type Eye color Home address Use of drug
- Determine what would be the most appropriate method of Colleting data today and the Scale of Measurement that will be used in a study to “Find the Number of schools that closed down in 2020 due to the CONVIRUS… Briefly explain justification of your choices in Number 1…PLease we’ve decided to create a survey on the population of pet owners in the Bay Area ranging from younger to older generation individuals. Number of pets owned Frequency Relative Frequency Cumulative Frequency 0 20 20/48=0.4167 20 1 14 14/48=0.29167 34 2 11 11/48=0.2292 45 3 3 3/48=0.0625 48 4 0 0/48=0 5 0 0/48=0 5 or more 0 0/48=0 Summarize your data in a chart with columns showing data value, frequency, relative frequency and cumulative relative frequency. ____Answer the following (rounded to 2 decimal places): 1. ?̅= 2. s = 3. First quartile = 4. Median = 5. 70th percentile = What value is 2 standard deviations above the mean? What value is 1.5 standard deviations below the mean? Construct a histogram displaying your data. In complete sentences, describe the shape of your graph. Do you notice any potential…4- It is desired to compare the grade point averages of the students studying industrial engineering for 3 different semesters. What is the measurement format of the variable to be compared? a) Discrete quantitative data B) Discrete qualitative data NS) None D) Continuous quantitative data TO) Continuous qualitative data
- Based on the data of air pollution in New Mexico in 2009, the Environmental Protection Agency (EPA) decided to publish a new stricter regulation effective in January 2010 to reduce hydrocarbon pollution. EPA wants to evaluate whether the new regulation makes significant differences in reducing pollution. EPA collects data of monthly hydrocarbon pollution level as follows: Table Attached Question: What is the hypothesis of the study?For this part of the project, you will calculate descriptive statistics for the first question, age, using the Excel spreadsheet your instructor will send with all the class data at the end of Module 2. This sheet will also provide space for you to do the following descriptive statistics under the “Module 3” tab: You will submit the Excel sheet with the following information: Make a Frequency Distribution with 5 classes, also list the midpoints, relative frequency, and cumulative relative frequency Make a cumulative relative frequency ogive Don’t forget descriptive title and labels on x and y axis (ogive is not descriptive, what does the graph represent?) Make a frequency polygon Don’t forget a descriptive title and labels on x and y axis (polygon is not descriptive, what does the graph represent?) Calculate the mean Calculate the median Calculate the sample standard deviation (our data is sample from our class, not a population!) Calculate the Q1 and Q3 valuesTo do this: You have been provided with two sets of data, one for concrete cube testing and the other for climatic information. You need to present the data using a range of charts and graphs before identifying statistically important variables and evaluating the data. First, using the concrete cube test results, you need to: Arrange the data into equal classes Determine the frequency distribution Draw the frequency histogram