To do this: You have been provided with two sets of data, one for concrete cube testing and the other for climatic information. You need to present the data using a range of charts and graphs before identifying statistically important variables and evaluating the data. First, using the concrete cube test results, you need to: Arrange the data into equal classes Determine the frequency distribution Draw the frequency histogram
To do this: You have been provided with two sets of data, one for concrete cube testing and the other for climatic information. You need to present the data using a range of charts and graphs before identifying statistically important variables and evaluating the data. First, using the concrete cube test results, you need to: Arrange the data into equal classes Determine the frequency distribution Draw the frequency histogram

MATLAB: An Introduction with Applications
6th Edition
ISBN:9781119256830
Author:Amos Gilat
Publisher:Amos Gilat
Chapter1: Starting With Matlab
Section: Chapter Questions
Problem 1P

Related questions
Question
100%
To do this:
You have been provided with two sets of data, one for concrete cube testing and the other for climatic information. You need to present the data using a range of charts and graphs before identifying statistically important variables and evaluating the data.
First, using the concrete cube test results, you need to:
-
Arrange the data into equal classes
-
Determine the frequency distribution
-
Draw the frequency histogram
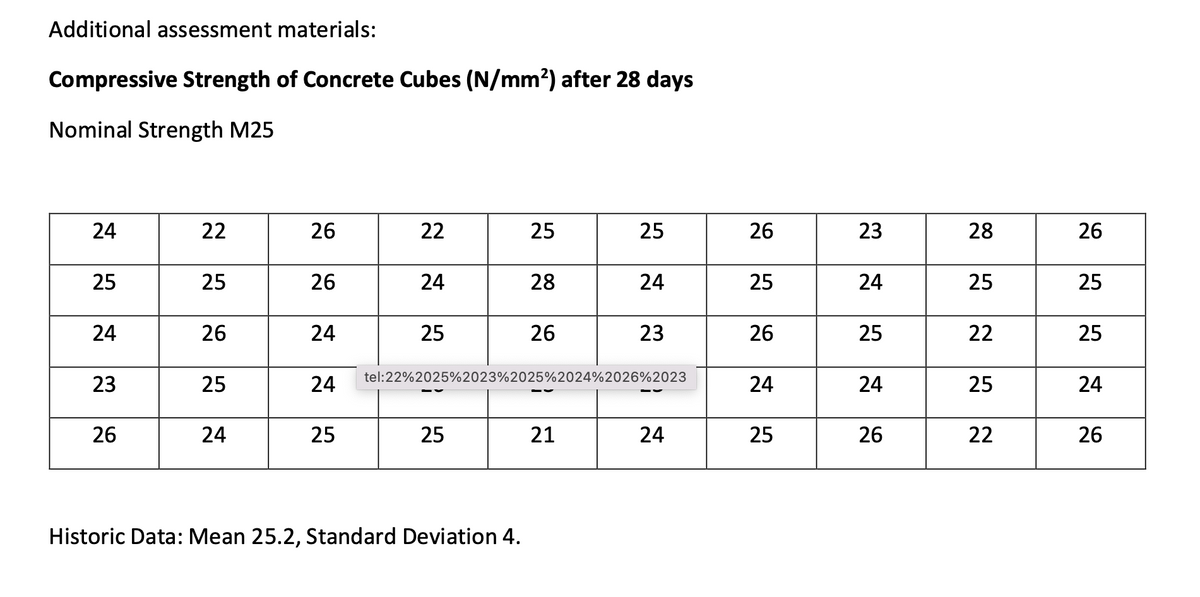
Transcribed Image Text:Additional assessment materials:
Compressive Strength of Concrete Cubes (N/mm²) after 28 days
Nominal Strength M25
24
25
24
23
26
22
25
26
25
24
26
26
24
24
25
22
24
25
25
25
Historic Data: Mean 25.2, Standard Deviation 4.
28
26
25
tel:22%2025%2023%2025%2024%2026%2023
21
24
23
24
26
25
26
24
25
23
24
25
24
26
28
25
22
25
22
26
25
25
24
26
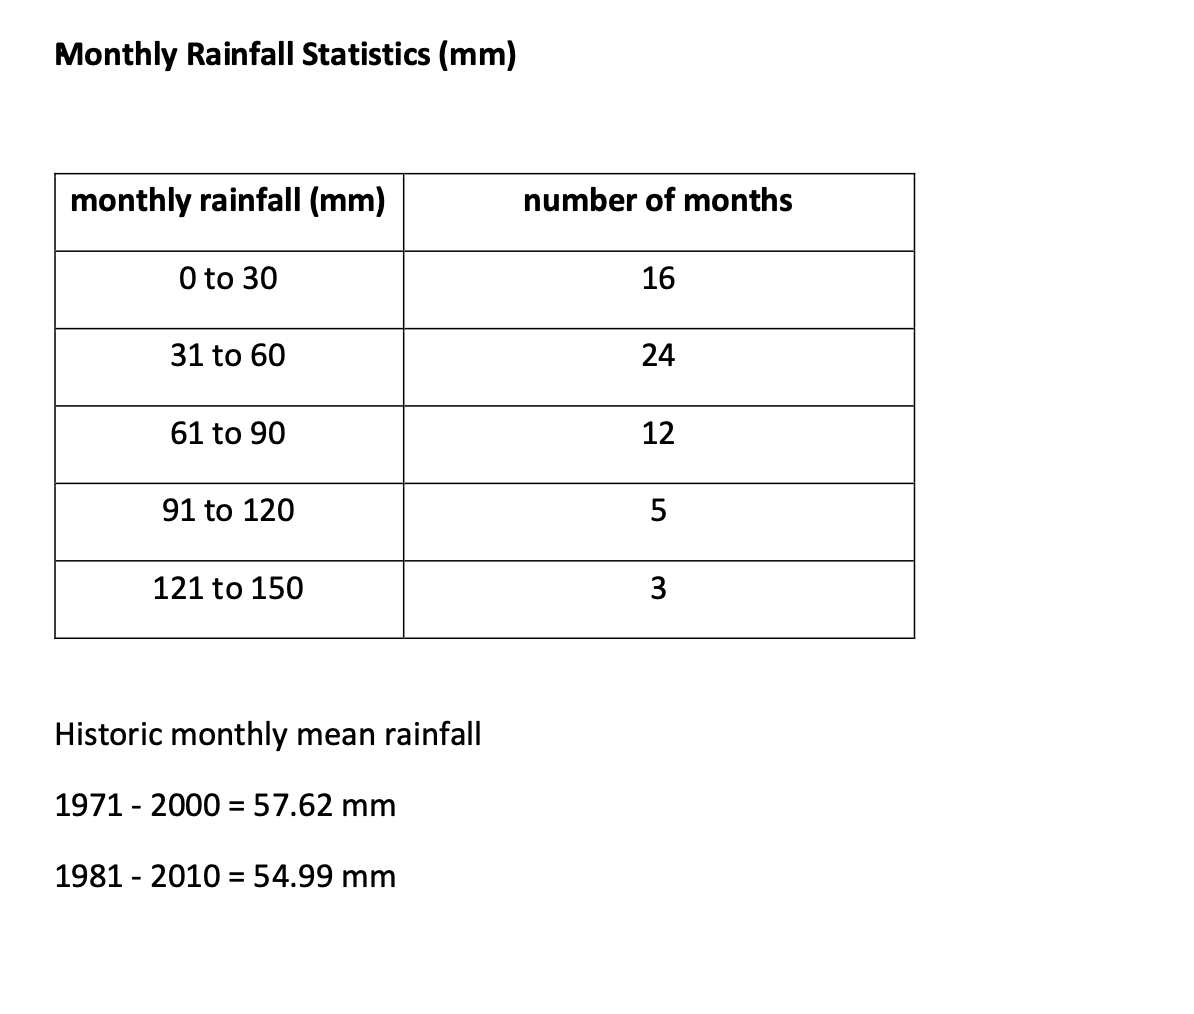
Transcribed Image Text:Monthly Rainfall Statistics (mm)
monthly rainfall (mm)
0 to 30
31 to 60
61 to 90
91 to 120
121 to 150
Historic monthly mean rainfall
1971 - 2000 = 57.62 mm
1981-2010 = 54.99 mm
number of months
16
24
12
5
3
Expert Solution
This question has been solved!
Explore an expertly crafted, step-by-step solution for a thorough understanding of key concepts.

Step by step
Solved in 3 steps with 1 images

Recommended textbooks for you
MATLAB: An Introduction with Applications
Statistics
ISBN:
9781119256830
Author:
Amos Gilat
Publisher:
John Wiley & Sons Inc

Probability and Statistics for Engineering and th…
Statistics
ISBN:
9781305251809
Author:
Jay L. Devore
Publisher:
Cengage Learning

Statistics for The Behavioral Sciences (MindTap C…
Statistics
ISBN:
9781305504912
Author:
Frederick J Gravetter, Larry B. Wallnau
Publisher:
Cengage Learning
MATLAB: An Introduction with Applications
Statistics
ISBN:
9781119256830
Author:
Amos Gilat
Publisher:
John Wiley & Sons Inc
Probability and Statistics for Engineering and th…
Statistics
ISBN:
9781305251809
Author:
Jay L. Devore
Publisher:
Cengage Learning
Statistics for The Behavioral Sciences (MindTap C…
Statistics
ISBN:
9781305504912
Author:
Frederick J Gravetter, Larry B. Wallnau
Publisher:
Cengage Learning

Elementary Statistics: Picturing the World (7th E…
Statistics
ISBN:
9780134683416
Author:
Ron Larson, Betsy Farber
Publisher:
PEARSON

The Basic Practice of Statistics
Statistics
ISBN:
9781319042578
Author:
David S. Moore, William I. Notz, Michael A. Fligner
Publisher:
W. H. Freeman

Introduction to the Practice of Statistics
Statistics
ISBN:
9781319013387
Author:
David S. Moore, George P. McCabe, Bruce A. Craig
Publisher:
W. H. Freeman