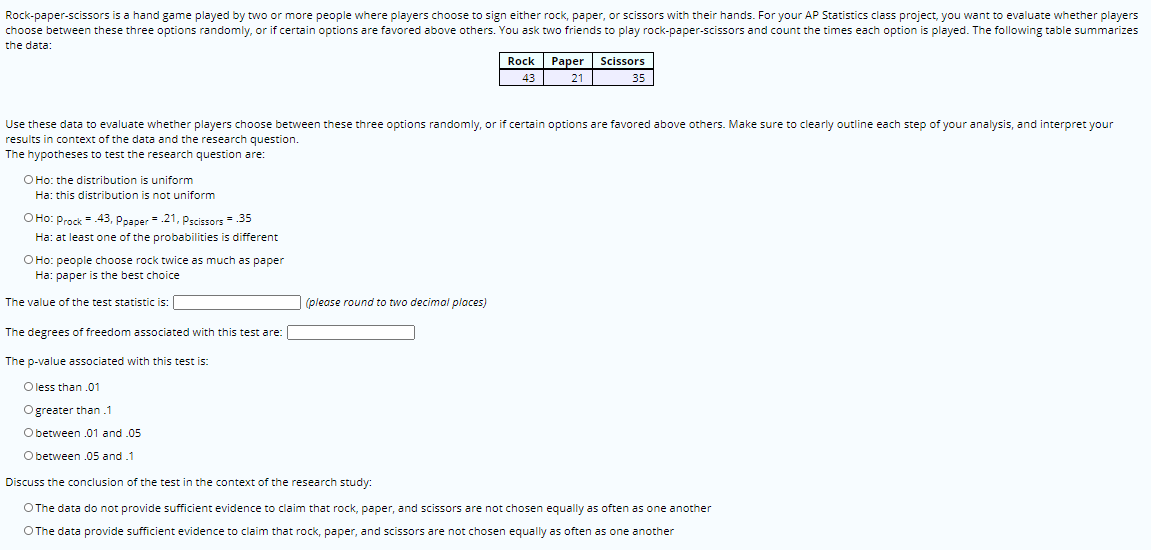
Rock-paper-scissors is a hand game played by two or more people where players choose to sign either rock, paper, or scissors with their hands. For your AP Statistics class project, you want to evaluate whether players choose between these three options randomly, or if certain options are favored above others. You ask two friends to play rock-paper-scissors and count the times each option is played. The following table summarizes the data: Rock Paper Scissors 43 21 35 Use these data to evaluate whether players choose between these three options randomly, or if certain options are favored above others. Make sure to clearly outline each step of your analysis, and interpret your results in context of the data and the research question. The hypotheses to test the research question are: O Ho: the distribution is uniform Ha: this distribution is not uniform O Ho: Prock = .43, Poaper =.21, pscissors - .35 Ha: at least one of the probabilities is different O Ho: people choose rock twice as much as paper Ha: paper is the best choice The value of the test statistic is: (please round to two decimal places) The degrees of freedom associated with this test are: The p-value associated with this test is: O less than .01 Ogreater than .1 Obetween .01 and .05 O between .05 and .1 Discuss the conclusion of the test in the context of the research study: OThe data do not provide sufficient evidence to claim that rock, paper, and scissors are not chosen equally as often as one another OThe data provide sufficient evidence to claim that rock, paper, and scissors are not chosen equally as often as one another
Rock-paper-scissors is a hand game played by two or more people where players choose to sign either rock, paper, or scissors with their hands. For your AP Statistics class project, you want to evaluate whether players choose between these three options randomly, or if certain options are favored above others. You ask two friends to play rock-paper-scissors and count the times each option is played. The following table summarizes the data: Rock Paper Scissors 43 21 35 Use these data to evaluate whether players choose between these three options randomly, or if certain options are favored above others. Make sure to clearly outline each step of your analysis, and interpret your results in context of the data and the research question. The hypotheses to test the research question are: O Ho: the distribution is uniform Ha: this distribution is not uniform O Ho: Prock = .43, Poaper =.21, pscissors - .35 Ha: at least one of the probabilities is different O Ho: people choose rock twice as much as paper Ha: paper is the best choice The value of the test statistic is: (please round to two decimal places) The degrees of freedom associated with this test are: The p-value associated with this test is: O less than .01 Ogreater than .1 Obetween .01 and .05 O between .05 and .1 Discuss the conclusion of the test in the context of the research study: OThe data do not provide sufficient evidence to claim that rock, paper, and scissors are not chosen equally as often as one another OThe data provide sufficient evidence to claim that rock, paper, and scissors are not chosen equally as often as one another

Glencoe Algebra 1, Student Edition, 9780079039897, 0079039898, 2018
18th Edition
ISBN:9780079039897
Author:Carter
Publisher:Carter
Chapter10: Statistics
Section: Chapter Questions
Problem 13PT

Related questions
Question
100%
Transcribed Image Text:Rock-paper-scissors is a hand game played by two or more people where players choose to sign either rock, paper, or scissors with their hands. For your AP Statistics class project, you want to evaluate whether players
choose between these three options randomly, or if certain options are favored above others. You ask two friends to play rock-paper-scissors and count the times each option is played. The following table summarizes
the data:
Rock
Раper
Scissors
43
21
35
Use these data to evaluate whether players choose between these three options randomly, or if certain options are favored above others. Make sure to clearly outline each step of your analysis, and interpret your
results in context of the data and the research question.
The hypotheses to test the research question are:
O Ho: the distribution is uniform
Ha: this distribution is not uniform
O Ho: Prock = 43, Poaper = .21, pscissors = 35
Ha: at least one of the probabilities is different
O Ho: people choose rock twice as much as paper
Ha: paper is the best choice
The value of the test statistic is:
(please round to two decimal places)
The degrees of freedom associated with this test are:
The p-value associated with this test is:
O less than .01
Ogreater than .1
Obetween .01 and .05
O between .05 and .1
Discuss the conclusion of the test in the context of the research study:
OThe data do not provide sufficient evidence to claim that rock, paper, and scissors are not chosen equally as often as one another
OThe data provide sufficient evidence to claim that rock, paper, and scissors are not chosen equally as often as one another
Expert Solution
This question has been solved!
Explore an expertly crafted, step-by-step solution for a thorough understanding of key concepts.

This is a popular solution!

Trending now
This is a popular solution!

Step by step
Solved in 2 steps

Knowledge Booster


Learn more about
Need a deep-dive on the concept behind this application? Look no further. Learn more about this topic, statistics and related others by exploring similar questions and additional content below.Recommended textbooks for you
Glencoe Algebra 1, Student Edition, 9780079039897…
Algebra
ISBN:
9780079039897
Author:
Carter
Publisher:
McGraw Hill

Holt Mcdougal Larson Pre-algebra: Student Edition…
Algebra
ISBN:
9780547587776
Author:
HOLT MCDOUGAL
Publisher:
HOLT MCDOUGAL

College Algebra (MindTap Course List)
Algebra
ISBN:
9781305652231
Author:
R. David Gustafson, Jeff Hughes
Publisher:
Cengage Learning
Glencoe Algebra 1, Student Edition, 9780079039897…
Algebra
ISBN:
9780079039897
Author:
Carter
Publisher:
McGraw Hill
Holt Mcdougal Larson Pre-algebra: Student Edition…
Algebra
ISBN:
9780547587776
Author:
HOLT MCDOUGAL
Publisher:
HOLT MCDOUGAL
College Algebra (MindTap Course List)
Algebra
ISBN:
9781305652231
Author:
R. David Gustafson, Jeff Hughes
Publisher:
Cengage Learning
