Rows: Gender Columns: Method of Payment American Proprietary Card Visa ess Discover Mastercard All Change Case 18 11 32 4 74 Femaie 43.24 24.32 14.86 12.16 5.41 100.00 90.00 68.75 69.23 80.00 36.36 74.00 18 11 32 4 74 Male 2 8 26 7.69 19.23 15.38 30.77 26.92 100.00 10.00 30.77 31.25 20.00 63.64 26.00 7 26 5 4 ll 20 16 13 40 11 100 16.00 20.00 13.00 40.00 11.00 100.00 100.00 100.00 100.00 100.00 100.00 100.00 100 20 16 13 40 11 Cell Contents Count % of Row % of olumn % of Total 2.


Q: 0 – 4 25 5 – 9 15 10 – 14 6 15 – 19 0 20 – 24…
A: Calculate Mode from the following grouped data Class Frequency 0 - 4 25 5 - 9 15 10 - 14 6…
Q: eam Name Division W L PCT Attendance Buffalo Bisons North 66 77 0.462 8818 Lehigh Valley IronPigs…
A: Note: AS per the guidelines, we are allowed to answer single question at a time. Kindly repost the…
Q: PRACTICE ANOTHER Are customers more loyal in the East or in the West? The following table is based…
A: "Since you have posted a question with multiple subparts, we will solve first 3 sub-parts for you.…
Q: Wife Alternating Husband Jointly Laundry 156 14 2 4 Main meal 124 20 4 Dinner 77 11 7 13 Breakfeast…
A: Chi square test are used to understand whether there is any association between the categorical…
Q: Race and Sex 1–14 15–24 25–64 over 64 TOTALS white, male 210 3,360 13,610 22,050…
A:
Q: a. Sort the carriers in descending order by their current year’s percentage of on-time deliveries.…
A: A) best: Blue Box Shipping worst: Rapid Response B) Option ii is correct answer Super Freights…
Q: Brand Apple Samsung LG Basic mobile phone Other smart phone Do not use mobile phone…
A: The relative frequency of an event can be obtained by dividing the frequency of the event by total…
Q: A person’s educational attainment and age group was collected by the U.S. Census Bureau in 1984 to…
A: Given data, Education 25-34 35-44 45-54 55-64 >64 Did not complete HS 5416 5030 5777 7606…
Q: 8.3 A person’s educational attainment and age group was collected by the U.S. Census Bureau in 1984…
A: Given information: 25 to 34 35 to 44 45 to 54 55 to 64 More than 64 Total…
Q: how do you answer these questions concerning this data table PROBLEM 12.2: Consider the following…
A: 1. What is the meaning of a case in each of the table? 2. What should the chain of R commands look…
Q: Boy 84 72 73 41 85 91 72 67 58 74 54 62 71 48 91 Girl 82 65 77 39 71 87 80…
A: First we will calculate the mean and standard deviation for both the samples Boy 84 72…
Q: A marketing research firm wishes to study the relationship between wine consumptlon and whether a…
A: Solution: The results table is Watch Tennis Do not watch Tennis Totals Drink Wine 5 26…
Q: Are customers more loyal in the East or in the West? The following table is based on information…
A: Hello! As you have posted 9 sub parts, we are answering the first 3 sub-parts. In case you…
Q: An electronics retailer list the sales (in thousands) of certain products in three cities for the…
A:
Q: 24. FILE A study is made by the recording industry in the United States of the number of music CDs…
A: Given data : Arrange in ascending order Seniors 28 , 35 , 41 , 48 , 52 , 81 , 97 , 98 , 98 , 99 ,…
Q: cebook apps: The following table presents the number of monthly users for the 15 most popular…
A:
Q: new website allows consumers to purchase various automobiles via the internet and then take delivery…
A: Given query is to find the profit matrix.
Q: A) Here is a contingency table from a new set of data. Please note that the total row and total…
A: For the given contengency table, we need to find: • How likely are Firefox users to purchase at…
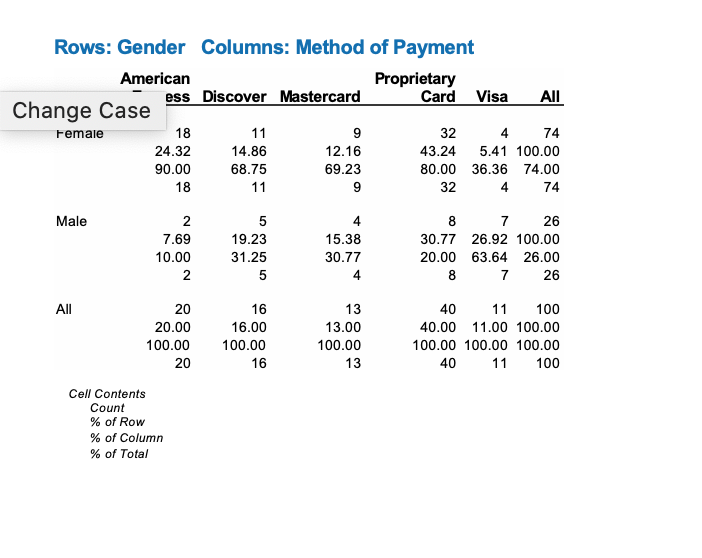
Q: How many participants (total) used an American express
A: Given Data and Total No of participants for American Expressways is marked in the table below
Q: A doctor studies sets of fraternal twins, where one newborn is a boy, and the other is a girl. She…
A: Let x1 and x2 are mean of sample 1 and 2 respectively and s1 and s2 are standard deviation of sample…
Q: An urban planner collects data on how park trails are used by residents. The planner looks at two…
A: General formula of probability ,
Q: U.S. Manufactured General Aviation Shipments, 1984–2016Year Planes Year Planes Year Planes Year…
A:
Q: Let there be three levels of the row variable and four levels of the column variable in a crosstab.…
A: It is been asked to find the sample size using given information.
Q: Are customers more loyal in the East or in the West? The following table is based on information…
A: Note:Hi! Thank you for posting the question. Since your question has more than 3 parts, we have…
Q: Scenario: A school conducted a blood donation camp. The blood groups of 30 students were recorded as…
A: We have to complete frequency distribution table..
Q: A pet store keeps track of the purchases of customers over a four hour period. The store manager…
A: Let, A denotes a dog product. B denotes a cat product. C denotes a fish product.…
Q: Race and Sex 1–14 15–24 25–64 over 64 TOTALS white, male 210 3,360 13,610 22,050…
A:
Q: Which of the following statements correctly defines the null hypothesis HO? A. level of…
A: Test is that whether the educational attainment and age are independent.
Q: The table below summarizes a data set regarding views on full-body scans and political affiliation.…
A: Observed values with marginal totals:
Q: 1. Are customers more loyal in the East or in the West? The following table is based on information…
A: Note: Thank you for the question. Since multiple subparts are posted, according to our policy, we…
Q: In a city, three newspapers A, B, and C are published. Subscription rates among the city's families…
A:
Q: The following crosstabulation summarizes the data for two categorical variables, x and y. The…
A:
Q: Are customers more loyal in the East or in the West? The following table is based on information…
A: Independent events:Two events A and B are independent if,
Q: Individual Experience Experience of Others Combination 24.5 20.6 21.0…
A: For the given data Perform Anova one way test to test the claim that errors are equal.
Q: Team Name Division W L PCT Attendance Buffalo Bisons North 66 77 0.462 8818 Lehigh Valley IronPigs…
A:
Q: 2. A doctor studies sets of fraternal twins, where one newborn is a boy, and the other is a girl.…
A: Two sample t test: Two sample t test is used to determine the significance difference between two…
Q: (b) A market researcher is interested in the factors that might effect movie ratings and has found…
A: Given : b) Column two through to four are the first year of the five year periodduring which the…
Q: A survey of 800 college seniors resulted in the following crosstabulation regarding their…
A: Given that survey of 800 college seniors resulted in the following crosstabulation regarding their…
Q: Count of Income Educ. Income 2 1 4 Grand Total 26 32 24 6. 88 55 81 98 32 266 3 90 203 51 144 61 346…
A: GivenThe excel output of data of house hold income and education level of the head of the house is…
Q: For each row and column total, calculate the corresponding row or column percentage.…
A:
Q: Match the given mutually and non- mutually exclusive event. COLUMN A COLUMN B A. 2) PCA) PCB)= B. !!…
A: This is a problem related to probability. Based on the definition of mutually exclusive event we…
Q: A marketing research firm wishes to study the relationship between wine consumption and whether a…
A: From the given information,
Q: oclal researcher decides to test whether an individual's age and their opinion on the legalization…
A: Calculation steps: The calculations have been done in EXCEL. Denote oij as the observed frequency…
Q: Player RBI HR AVG Salary (in millions) Prince Fielder 44 8 0.212 18.000 Jean Segura 64 20 0.320…
A: Let Y be the salary in millions X be the batting average. Here we have to estimate player's salary…
Q: The table below summarizes a data set regarding views on full-body scans and political affiliation.…
A: We want to find expected Democrats to support of full-body scans
Q: City Price ($) Sales (cases) Bakersfield 34.99 581 Los Angeles 38.99 1,475 Modesto 36.00 324 Oakland…
A: Following calculation can be caried out from the given table.
Q: The following table shows the distribution of employees in an organization. Martha Foreman, an…
A: The row of Asians is given by, 10, 11, 10, 0
Q: < Social media habits by region 90% 89% 87% 80% 70% 50% 40% 30% 20% 10% 0% 90% 73% 65% 70% 63% 35%…
A:
Q: A farmer is concerned that a change in fertilizer to an organic variant might change his crop yield.…
A: From the given data: Old Fertilizer (x) New Fertilizer (y) d=x-y d2 10 12 -2 4 13 12 1 1 12…
Q: The data below represent the responses to two questions asked in a survey of 40 college students…
A:
Cross Tabulation Data- What % of males used Discover? How to solve this

Step by step
Solved in 2 steps


- Cholesterol Cholesterol in human blood is necessary, but too much can lead to health problems. There are three main types of cholesterol: HDL (high-density lipoproteins), LDL (low-density lipoproteins), and VLDL (very low-density lipoproteins). HDL is considered “good” cholesterol; LDL and VLDL are considered “bad” cholesterol. A standard fasting cholesterol blood test measures total cholesterol, HDL cholesterol, and triglycerides. These numbers are used to estimate LDL and VLDL, which are difficult to measure directly. Your doctor recommends that your combined LDL/VLDL cholesterol level be less than 130 milligrams per deciliter, your HDL cholesterol level be at least 60 milligrams per deciliter, and your total cholesterol level be no more than 200 milligrams per deciliter. (a) Write a system of linear inequalities for the recommended cholesterol levels. Let x represent the HDL cholesterol level, and let y represent the combined LDL VLDL cholesterol level. (b) Graph the system of inequalities from part (a). Label any vertices of the solution region. (c) Is the following set of cholesterol levels within the recommendations? Explain. LDL/VLDL: 120 milligrams per deciliter HDL: 90 milligrams per deciliter Total: 210 milligrams per deciliter (d) Give an example of cholesterol levels in which the LDL/VLDL cholesterol level is too high but the HDL cholesterol level is acceptable. (e) Another recommendation is that the ratio of total cholesterol to HDL cholesterol be less than 4 (that is, less than 4 to 1). Identify a point in the solution region from part (b) that meets this recommendation, and explain why it meets the recommendation.My question for my stats homework comes from the textbook Introduction to the Practice of Statistics Ninth Edition. This comes from section exercise 1.80. from the textbook, my professor wants me to caluate using the three columns. Can you help me slove this problem for me?Company A receives large shipments of microprocessors from Company B. It must try to ensure the proportion of microprocessors that are defective is small. Suppose Company A decides to test ten microprocessors out of a shipment of thousands of these microprocessors. Suppose that if at least one of the microprocessors is defective, the shipment is returned. Complete parts a through c. a. If Company B's shipment contains 8% defective microprocessors, calculate the probability the entire shipment will be returned. The probability is nothing.
- Apportionmentl. Two hundred new medicine board passer will be assigned in the different provincial hospitals of the different regions. Data of the hospitals as follows. Apportion the doctors in the different hospital by using Hamilton and Jefferson Plan to justify the answer. Show solution. RegionalHospital Bed capacityRegion 1 75Region 2 105Region 3 250NCR 400Region 4 162Region 5 134Insurance companies can lower their risks by A) using the law of large numbers to make the number of claims more predictable. B) diversifying across insurance products. C) granting large numbers of independent risk policies. D) all of the aboveCompany A receives large shipments of microprocessors from Company B. It must try to ensure the proportion of microprocessors that are defective is small. Suppose Company A decides to test 10 microprocessors out of a shipment of thousands of these microprocessors. Suppose that if at least one of the microprocessors is defective, the shipment is returned. Complete parts a through c.a. If Company B's shipment contains 8% defective microprocessors, calculate the probability the entire shipment will be returned.The probability is0.5656.(Round to four decimal places as needed.) I only need answer to B below:b. If Company B and Company A agree that Company B will not provide more than 3% defective chips, calculate the probability that the entire shipment will be returned even though only 3% are defective.The probability is (Round to four decimal places as needed.)
- Company A receives large shipments of microprocessors from Company B. It must try to ensure the proportion of microprocessors that are defective is small. Suppose Company A decides to test ten microprocessors out of a shipment of thousands of these microprocessors. Suppose that if at least one of the microprocessors is defective, the shipment is returned. Complete parts a through c. a. If Company B's shipment contains 12% defective microprocessors, calculate the probability the entire shipment will be returned. The probability is nothing. (Round to four decimal places as needed.) If Company B and Company A agree that Company B will not provide more than 5% defective chips, calculate the probability that the entire shipment will be returned even though only 5% are defective. The probability is (please show how you achieved answer).An investigative journalist is writing a report about the amount of sodium in snack foods. They believe name-brand snack foods have higher sodium levels than store-brand snack foods. They randomly select 8 pairs of common snack food types (purchasing a name-brand and store-brand for each type) and use a lab to determine how much sodium is in every 100 grams of snack food. Note: d=(Name-brand−Store-brand) Name-brand (in milligrams) Store-brand (in milligrams) 519 519 469 462 418 410 328 327 741 740 637 632 282 270 554 541 Assume that both of the populations are normally distributed. At the 0.10 level of significance, is there sufficient evidence to show there are higher sodium levels for name-brand snacks than store-brand snacks? Find the test statistic, t0. Round your answer to the nearest hundredth.Here are some summary statistics for the numbers of hectares of olives and apples harvested per region, for area that planted those crops. In Region A, there were 36 hectares of olives harvested and 18 hectares of Apples harvested. Relative to its crop, which plant had a better harvest? A: They had equally good harvests relative to their crops. B: The Olives. C: It’s impossible to say without seeing all of the harvest amounts. D: The Apples.
- A researcher's survey results indicate that about 50% of 12th graders consume less than 300g of vegetables at lunch, about 40% consume 300-600g, and only 10% of them consume more than 600g. A high school conducted a survey of student diets and health information, and reported data about 12th graders' vegetable intake at lunch is reported in the table photo. If researchers wants to find out whether the high school has the same proportions of 12th graders in the vegetable intake categories as reported by the survey, what would the appropiate test statistic be to use and why. Choosing between an ANOVA, Chi -Square independence tests, Chi Square Goodness of Fit, and One sample proportion test?An industrial engineer is investigating the effect of four assembly methods (A, B, C, D) on the assembly time for a color television component. Four operators are selected for the study. Furthermore, the engineer knows that each assembly method produces such fatigue that the time required for the last assembly may be greater than the time required for the first, regardless of the method. That is, a trend develops in the required assembly time. To account for this source of variability, the engineer uses the Latin square design shown below. Analyze the data from this experiment ( = 0.05) draw appropriate conclusions by conducting hypothesis testing. Order of Operator Assembly 1 2 3 4 1 C=10 D=14 A=7 B=8 2 B=7 C=18 D=11 A=8 3 A=5 B=10 C=11 D=9 4 D=10 A=10 B=12 C=14How do i find the occupancy rate for multiple lots? This spreadsheets contains more lots than given. I only provided are part of lot 1 and a part of lot 2 because the file is too large. They all run together in one file and need the occupancy rate which is column D on my spreadsheet. LotCode LotCapacity LotOccupancy OccupancyRate TimeStamp Day Lot01 863 174 11/20/2016 8:01 Sunday Lot01 863 179 11/20/2016 8:27 Sunday Lot01 863 189 11/20/2016 9:01 Sunday Lot01 863 197 11/20/2016 9:27 Sunday Lot01 863 226 11/20/2016 10:01 Sunday Lot01 863 247 11/20/2016 10:27 Sunday Lot01 863 331 11/20/2016 11:01 Sunday Lot01 863 400 11/20/2016 11:27 Sunday Lot01 863 469 11/20/2016 12:01 Sunday Lot01 863 510 11/20/2016 12:34 Sunday Lot01 863 594 11/20/2016 13:07 Sunday Lot01 863 618 11/20/2016 13:27 Sunday Lot01 863 637 11/20/2016 14:01 Sunday Lot01 863 655 11/20/2016 14:27 Sunday Lot01 863 634 11/20/2016 15:01 Sunday Lot01 863 597…
