24. FILE A study is made by the recording industry in the United States of the number of music CDs owned by 25 senior citizens and 30 young adults. The information is reported below. Seniors 28 35 41 48 52 81 97 98 98 99 118 132 133 140 145 147 153 158 162 174 177 180 180 187 188 Young Adults 81 107 113 147 147 175 183 192 202 209 233 251 254 266 283 284 284 316 372 401 417 423 490 500 507 518 550 557 590 594 a. Find the median and the first and third quartiles for the number of CDs owned by senior citizens. Develop a box plot for the information. b. Find the median and the first and third quartiles for the number of CDs owned by young adults. Develop a box plot for the information. c. Compare the number of CDs owned by the two groups.
24. FILE A study is made by the recording industry in the United States of the number of music CDs owned by 25 senior citizens and 30 young adults. The information is reported below. Seniors 28 35 41 48 52 81 97 98 98 99 118 132 133 140 145 147 153 158 162 174 177 180 180 187 188 Young Adults 81 107 113 147 147 175 183 192 202 209 233 251 254 266 283 284 284 316 372 401 417 423 490 500 507 518 550 557 590 594 a. Find the median and the first and third quartiles for the number of CDs owned by senior citizens. Develop a box plot for the information. b. Find the median and the first and third quartiles for the number of CDs owned by young adults. Develop a box plot for the information. c. Compare the number of CDs owned by the two groups.

Glencoe Algebra 1, Student Edition, 9780079039897, 0079039898, 2018
18th Edition
ISBN:9780079039897
Author:Carter
Publisher:Carter
Chapter10: Statistics
Section10.6: Summarizing Categorical Data
Problem 21PPS

Related questions

Concept explainers
Contingency Table
A contingency table can be defined as the visual representation of the relationship between two or more categorical variables that can be evaluated and registered. It is a categorical version of the scatterplot, which is used to investigate the linear relationship between two variables. A contingency table is indeed a type of frequency distribution table that displays two variables at the same time.
Binomial Distribution
Binomial is an algebraic expression of the sum or the difference of two terms. Before knowing about binomial distribution, we must know about the binomial theorem.
Topic Video
Question
24
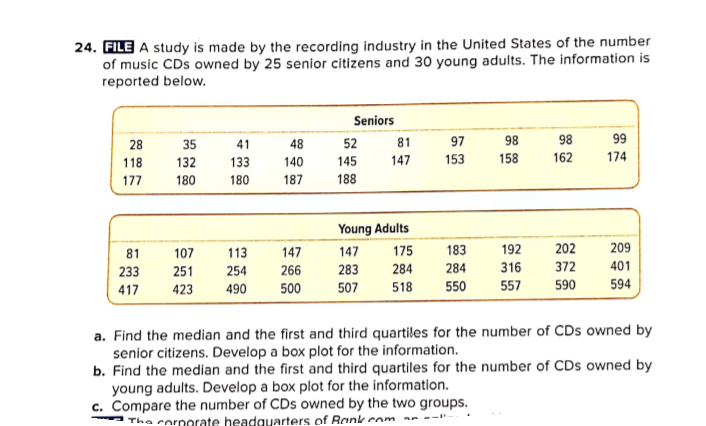
Transcribed Image Text:24. FILE A study is made by the recording industry in the United States of the number
of music CDs owned by 25 senior citizens and 30 young adults. The information is
reported below.
Seniors
28
35
41
48
52
81
97
98
98
99
118
132
133
140
145
147
153
158
162
174
177
180
180
187
188
Young Adults
81
107
113
147
147
175
183
192
202
209
233
251
254
266
283
284
284
316
372
401
417
423
490
500
507
518
550
557
590
594
a. Find the median and the first and third quartiles for the number of CDs owned by
senior citizens. Develop a box plot for the information.
b. Find the median and the first and third quartiles for the number of CDs owned by
young adults. Develop a box plot for the information.
c. Compare the number of CDs owned by the two groups.
Tha cornorate headguarters of Rank com
Expert Solution
This question has been solved!
Explore an expertly crafted, step-by-step solution for a thorough understanding of key concepts.

This is a popular solution!

Trending now
This is a popular solution!

Step by step
Solved in 4 steps with 2 images

Knowledge Booster


Learn more about
Need a deep-dive on the concept behind this application? Look no further. Learn more about this topic, statistics and related others by exploring similar questions and additional content below.Recommended textbooks for you
Glencoe Algebra 1, Student Edition, 9780079039897…
Algebra
ISBN:
9780079039897
Author:
Carter
Publisher:
McGraw Hill

Holt Mcdougal Larson Pre-algebra: Student Edition…
Algebra
ISBN:
9780547587776
Author:
HOLT MCDOUGAL
Publisher:
HOLT MCDOUGAL

Glencoe Algebra 1, Student Edition, 9780079039897…
Algebra
ISBN:
9780079039897
Author:
Carter
Publisher:
McGraw Hill
Holt Mcdougal Larson Pre-algebra: Student Edition…
Algebra
ISBN:
9780547587776
Author:
HOLT MCDOUGAL
Publisher:
HOLT MCDOUGAL