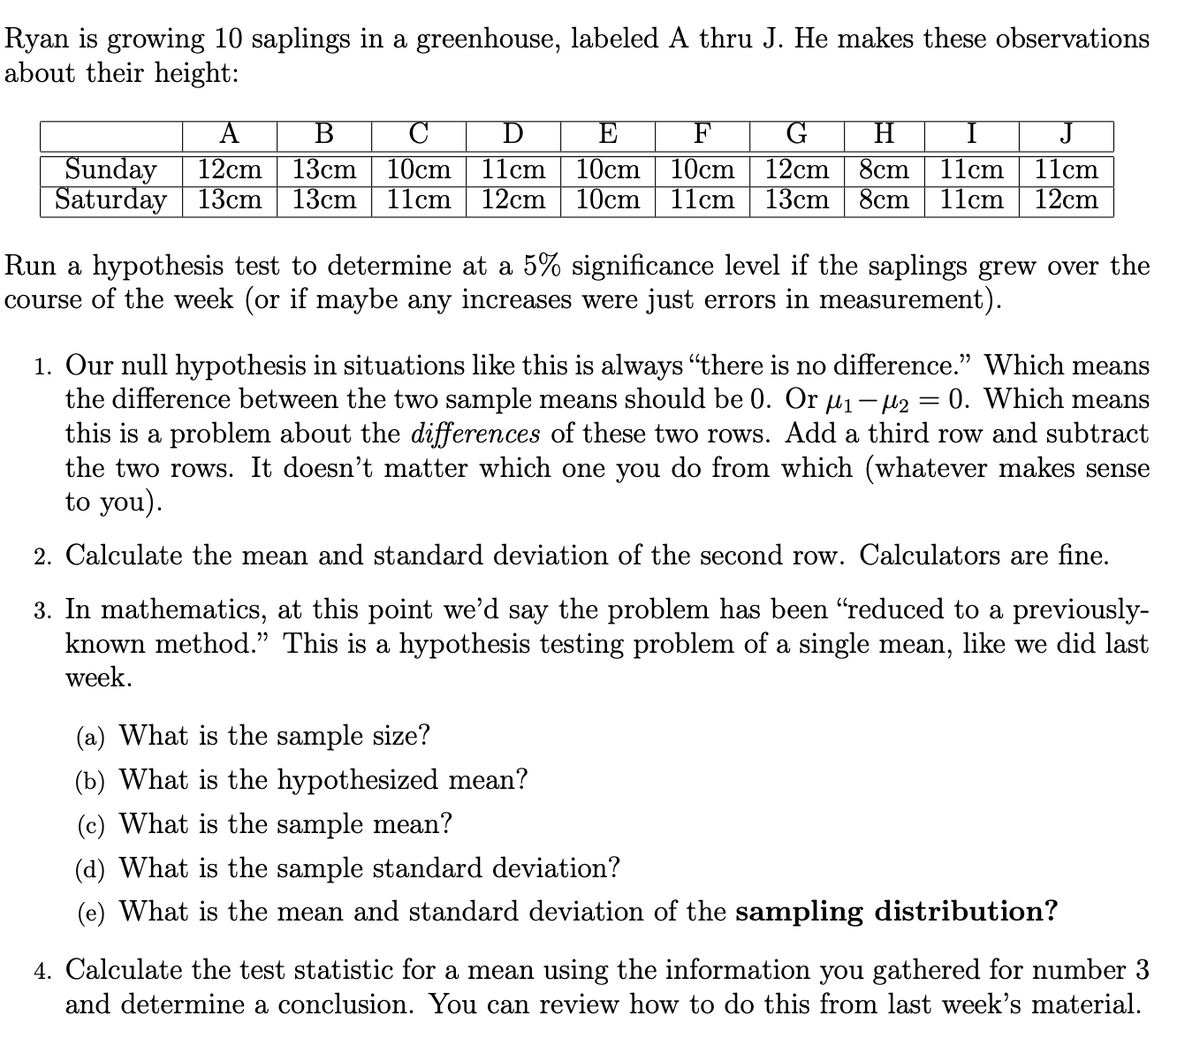
Ryan is growing 10 saplings in a greenhouse, labeled A thru J. He makes these observations about their height: E F G H. 8cm 12cm 13cm | 8cm B J Sunday Saturday 13cm 13cm 13cm 11cm 11cm 11cm 12cm 12cm 10cm 11cm 11cm 12cm 10cm 10cm 10cm 11cm Run a hypothesis test to determine at a 5% significance level if the saplings grew over the course of the week (or if maybe any increases were just errors in measurement). 1. Our null hypothesis in situations like this is always "there is no difference." Which means the difference between the two sample means should be 0. Or µ1– µ2 = 0. Which means this is a problem about the differences of these two rows. Add a third row and subtract the two rows. It doesn't matter which one you do from which (whatever makes sense to you). 2. Calculate the mean and standard deviation of the second row. Calculators are fine. 3. In mathematics, at this point we'd say the problem has been “reduced to a previously- known method." This is a hypothesis testing problem of a single mean, like we did last week. (a) What is the sample size? (b) What is the hypothesized mean? (c) What is the sample mean? (d) What is the sample standard deviation? (e) What is the mean and standard deviation of the sampling distribution?
Ryan is growing 10 saplings in a greenhouse, labeled A thru J. He makes these observations about their height: E F G H. 8cm 12cm 13cm | 8cm B J Sunday Saturday 13cm 13cm 13cm 11cm 11cm 11cm 12cm 12cm 10cm 11cm 11cm 12cm 10cm 10cm 10cm 11cm Run a hypothesis test to determine at a 5% significance level if the saplings grew over the course of the week (or if maybe any increases were just errors in measurement). 1. Our null hypothesis in situations like this is always "there is no difference." Which means the difference between the two sample means should be 0. Or µ1– µ2 = 0. Which means this is a problem about the differences of these two rows. Add a third row and subtract the two rows. It doesn't matter which one you do from which (whatever makes sense to you). 2. Calculate the mean and standard deviation of the second row. Calculators are fine. 3. In mathematics, at this point we'd say the problem has been “reduced to a previously- known method." This is a hypothesis testing problem of a single mean, like we did last week. (a) What is the sample size? (b) What is the hypothesized mean? (c) What is the sample mean? (d) What is the sample standard deviation? (e) What is the mean and standard deviation of the sampling distribution?

Holt Mcdougal Larson Pre-algebra: Student Edition 2012
1st Edition
ISBN:9780547587776
Author:HOLT MCDOUGAL
Publisher:HOLT MCDOUGAL
Chapter11: Data Analysis And Probability
Section: Chapter Questions
Problem 8CR

Related questions
Topic Video
Question
This uses the classical method / critical value method. Not the p-value method.
Show step by Step
Transcribed Image Text:Ryan is growing 10 saplings in a greenhouse, labeled A thru
about their height:
He makes these observations
A
B
E
F
G
H.
I
Sunday
11cm
11cm
12cm
13cm
10cm 11сm
10cm
12cm 8cm
13cm 8cm
11cm
12cm
10cm
Saturday 13cm 13cm 11cm 12cm 10cm | 11cm
Run a hypothesis test to determine at a 5% significance level if the saplings grew over the
course of the week (or if maybe any increases were just errors in measurement).
1. Our null hypothesis in situations like this is always "there is no difference." Which means
the difference between the two sample means should be 0. Or u1- u2 = 0. Which means
this is a problem about the differences of these two rows. Add a third row and subtract
the two rows. It doesn't matter which one you do from which (whatever makes sense
to you).
2. Calculate the mean and standard deviation of the second row. Calculators are fine.
3. In mathematics, at this point we'd say the problem has been "reduced to a previously-
known method." This is a hypothesis testing problem of a single mean, like we did last
week.
(a) What is the sample size?
(b) What is the hypothesized mean?
(c) What is the sample mean?
(d) What is the sample standard deviation?
(e) What is the mean and standard deviation of the sampling distribution?
4. Calculate the test statistic for a mean using the information you gathered for number 3
and determine a conclusion. You can review how to do this from last week's material.
Expert Solution
This question has been solved!
Explore an expertly crafted, step-by-step solution for a thorough understanding of key concepts.

Step by step
Solved in 2 steps

Knowledge Booster


Learn more about
Need a deep-dive on the concept behind this application? Look no further. Learn more about this topic, statistics and related others by exploring similar questions and additional content below.Recommended textbooks for you
Holt Mcdougal Larson Pre-algebra: Student Edition…
Algebra
ISBN:
9780547587776
Author:
HOLT MCDOUGAL
Publisher:
HOLT MCDOUGAL

College Algebra
Algebra
ISBN:
9781305115545
Author:
James Stewart, Lothar Redlin, Saleem Watson
Publisher:
Cengage Learning

Algebra & Trigonometry with Analytic Geometry
Algebra
ISBN:
9781133382119
Author:
Swokowski
Publisher:
Cengage
Holt Mcdougal Larson Pre-algebra: Student Edition…
Algebra
ISBN:
9780547587776
Author:
HOLT MCDOUGAL
Publisher:
HOLT MCDOUGAL
College Algebra
Algebra
ISBN:
9781305115545
Author:
James Stewart, Lothar Redlin, Saleem Watson
Publisher:
Cengage Learning
Algebra & Trigonometry with Analytic Geometry
Algebra
ISBN:
9781133382119
Author:
Swokowski
Publisher:
Cengage

College Algebra (MindTap Course List)
Algebra
ISBN:
9781305652231
Author:
R. David Gustafson, Jeff Hughes
Publisher:
Cengage Learning