s as needed.) ntercept, if appropriate. Squares regression line

Linear Algebra: A Modern Introduction
4th Edition
ISBN:9781285463247
Author:David Poole
Publisher:David Poole
Chapter7: Distance And Approximation
Section7.3: Least Squares Approximation
Problem 31EQ

Related questions
Question
Practice Pack
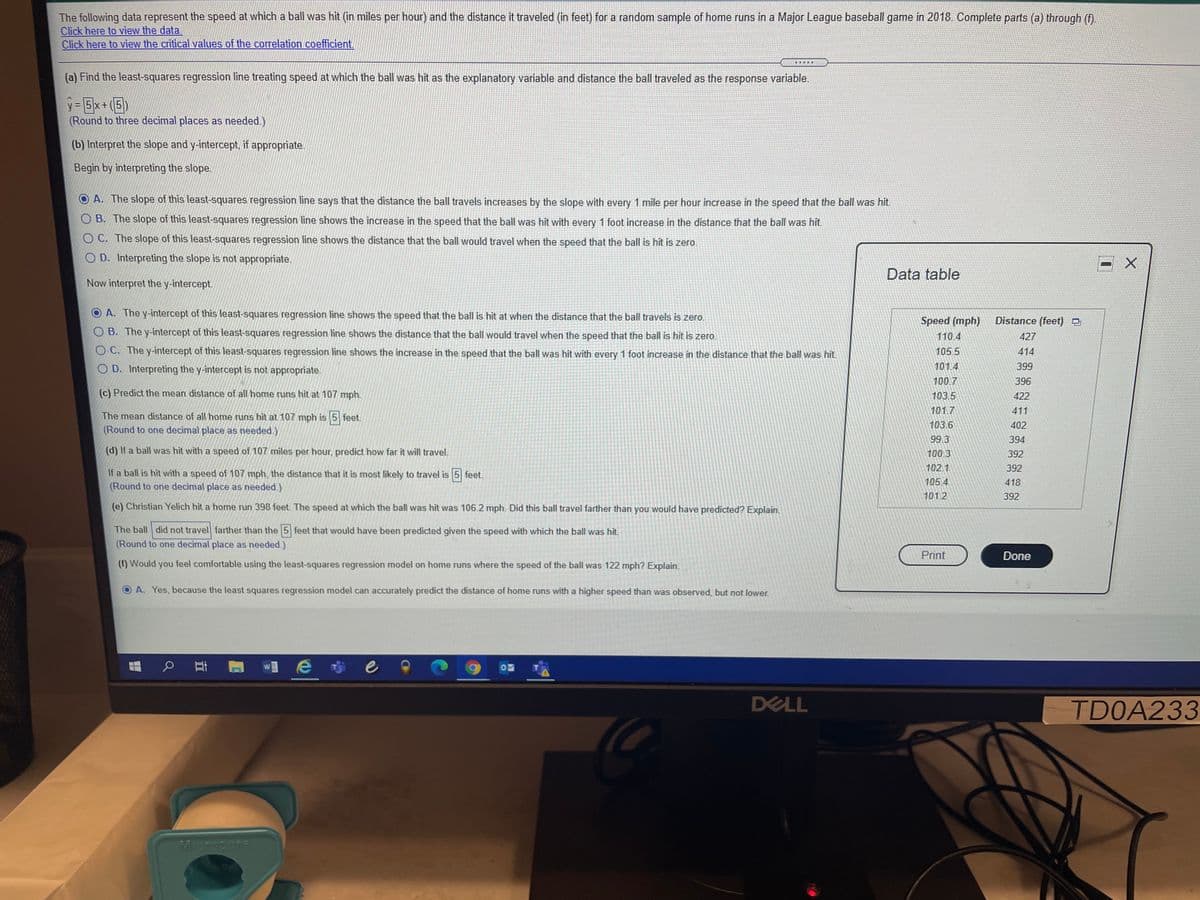
Transcribed Image Text:The following data represent the speed at which a ball was hit (in miles per hour) and the distance it traveled (in feet) for a random sample of home runs in a Major League baseball game in 2018. Complete parts (a) through (f).
Click here to view the data.
Click here to view the critical values of the correlation coefficient.
(a) Find the least-squares regression line treating speed at which the ball was hit as the explanatory variable and distance the ball traveled as the response variable.
y = 5x+ (5
(Round to three decimal places as needed.)
(b) Interpret the slope and y-intercept, if appropriate.
Begin by interpreting the slope.
A. The slope of this least-squares regression line says that the distance the ball travels increases by the slope with every 1 mile per hour increase in the speed that the ball was hit.
O B. The slope of this least-squares regression line shows the increase in the speed that the ball was hit with every 1 foot increase in the distance that the ball was hit.
O C. The slope of this least-squares regression line shows the distance that the ball would travel when the speed that the ball is hit is zero.
O D. Interpreting the slope is not appropriate.
Data table
Now interpret the y-intercept.
A. The y-intercept of this least-squares regression line shows the speed that the ball is hit at when the distance that the ball travels is zero.
Speed (mph)
Distance (feet)
O B. The y-intercept of this least-squares regression line shows the distance that the ball would travel when the speed that the ball is hit is zero.
110.4
427
OC. The y-intercept of this least-squares regression line shows the increase in the speed that the ball was hit with every 1 foot increase in the distance that the ball was hit.
105.5
414
O D. Interpreting the y-intercept is not appropriate.
101.4
399
100.7
396
(c) Predict the mean distance of all home runs hit at 107 mph.
103.5
101.7
422
411
The mean distance of all home runs hit at 107 mph is 5 feet.
(Round to one decimal place as needed.)
103.6
402
99 3
394
(d) If a ball was hit with a speed of 107 miles per hour, predict how far it will travel.
100.3
392
102.1
392
If a ball is hit with a speed of 107 mph, the distance that it is most likely to travel is 5 feet.
(Round to one decimal place as needed.)
105 4
418
101.2
392
(e) Christian Yelich hit a home run 398 feet. The speed at which the ball was hit was 106.2 mph. Did this ball travel farther than you would have predicted? Explain.
The ball did not travel farther than the 5 feet that would have been predicted given the speed with which the ball was hit.
(Round to one decimal place as needed.)
Print
Done
(f) Would you feel comfortable using the least-squares regression model on home runs where the speed of the ball was 122 mph? Explain.
A. Yes, because the least squares regression model can accurately predict the distance of home runs with a higher speed than was observed, but not lower.
耳
ae市e
DELL
TD0A233
Morobore
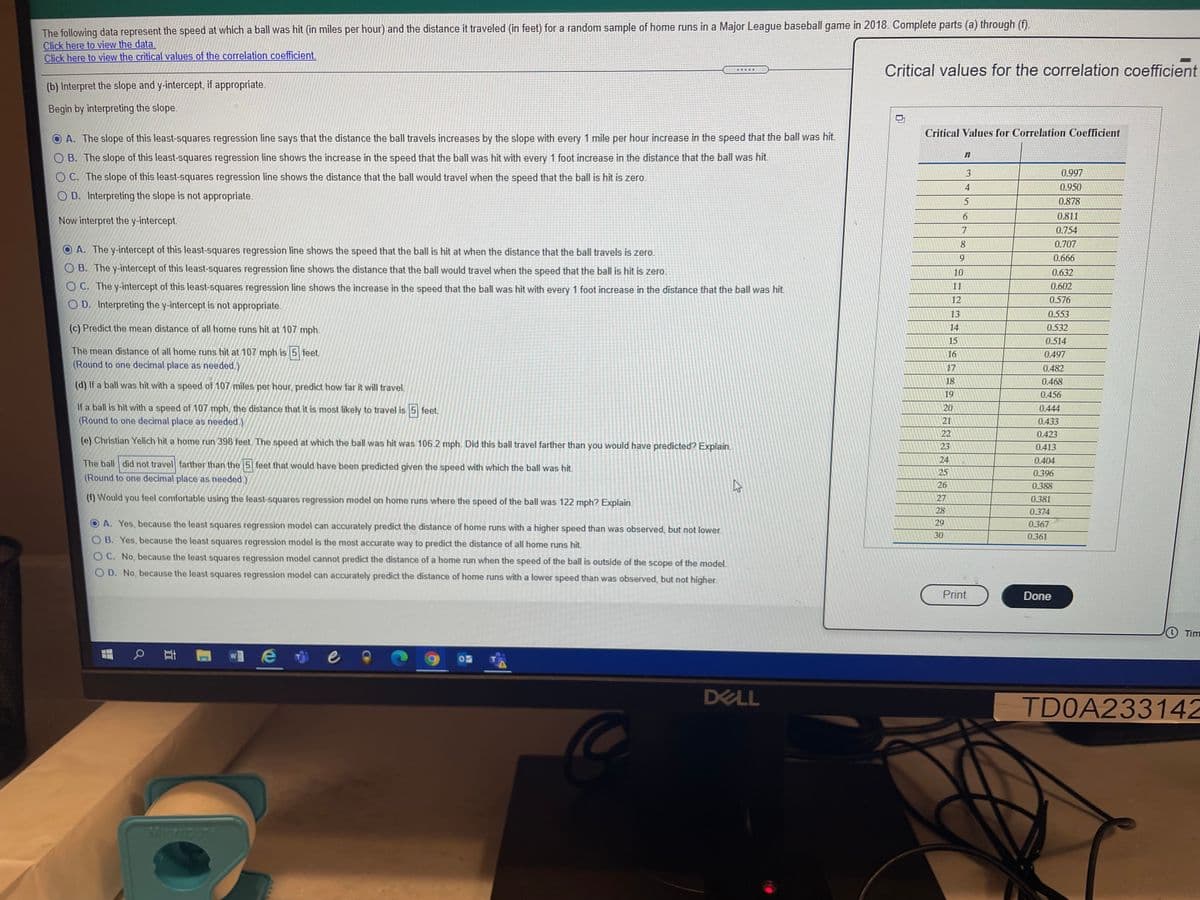
Transcribed Image Text:The following data represent the speed at which a ball was hit (in miles per hour) and the distance it traveled (in feet) for a random sample of home runs in a Major League baseball game in 2018. Complete parts (a) through (f).
Click here to view the data.
Click here to view the critical values of the correlation coefficient.
Critical values for the correlation coefficient
(b) Interpret the slope and y-intercept, if appropriate.
Begin by interpreting the slope.
Critical Values for Correlation Coefficient
A. The slope of this least-squares regression line says that the distance the ball travels increases by the slope with every 1 mile per ho
increase in the speed that the ball was hit.
O B. The slope of this least-squares regression line shows the increase in the speed that the ball was hit with every 1 foot increase in the distance that the ball was hit.
0.997
O C. The slope of this least-squares regression line shows the distance that the ball would travel when the speed that the ball is hit is zero.
4
0.950
O D. Interpreting the slope is not appropriate.
5
0.878
6
0.811
Now interpret the y-intercept.
0.754
0.707
O A. The y-intercept of this least-squares regression line shows the speed that the ball is hit at when the distance that the ball travels is zero
0.666
O B. The y-intercept of this least-squares regression line shows the distance that the ball would travel when the speed that the ball is hit is zero.
10
0.632
OC. The y-intercept of this least-squares regression line shows the increase in the speed that the ball was hit with every 1 foot increase in the distance that the ball was hit.
0.602
11
12
0.576
O D. Interpreting the y-intercept is not appropriate.
13
0.553
(c) Predict the mean distance of all home runs hit at 107 mph.
14
0.532
15
0.514
The mean distance of all home runs hit at 107 mph is 5 feet.
16
0.497
(Round to one decimal place as needed.)
17
0.482
18
0.468
(d) If a ball was hit with a speed of 107 miles per hour, predict how far it will travel.
19
0.456
If a ball is hit with a speed of 107 mph, the distance that it is most likely to travel is 5 feet.
(Round to one decimal place as needed.)
20
0.444
21
0.433
22
0.423
(e) Christian Yelich hit a home run 398 feet. The speed at which the ball was hit was 106.2 mph. Did this ball travel farther than you would have predicted? Explain.
23
0.413
The ball did not travel farther than the 5 feet that would have been predicted given the speed with which the ball was hit.
24
0.404
25
0.396
(Round to one decimal place as needed.)
26
0.388
(f) Would you feel comfortable using the least-squares regression model on home runs where the speed of the ball was 122 mph? Explain.
27
0.381
28
0.374
O A. Yes, because the least squares regression model can accurately predict the distance of home runs with a higher speed than was observed, but not lower.
29
0.367
30
0.361
O B. Yes, because the least squares regression model is the most accurate way to predict the distance of all home runs hit
OC. No, because the least squares regression model cannot predict the distance of a home run when the speed of the ball is outside of the scope of the model.
O D. No, because the least squares regression model can accurately predict the distance of home runs with a lower speed than was observed, but not higher.
Print
Done
Tim
p 耳
DELL
TD0A233142
Mcrabore
Expert Solution
This question has been solved!
Explore an expertly crafted, step-by-step solution for a thorough understanding of key concepts.

This is a popular solution!

Includes step-by-step video

Trending now
This is a popular solution!

Learn your way
Includes step-by-step video

Step by step
Solved in 3 steps with 4 images

Recommended textbooks for you
Linear Algebra: A Modern Introduction
Algebra
ISBN:
9781285463247
Author:
David Poole
Publisher:
Cengage Learning

Glencoe Algebra 1, Student Edition, 9780079039897…
Algebra
ISBN:
9780079039897
Author:
Carter
Publisher:
McGraw Hill

Big Ideas Math A Bridge To Success Algebra 1: Stu…
Algebra
ISBN:
9781680331141
Author:
HOUGHTON MIFFLIN HARCOURT
Publisher:
Houghton Mifflin Harcourt
Linear Algebra: A Modern Introduction
Algebra
ISBN:
9781285463247
Author:
David Poole
Publisher:
Cengage Learning
Glencoe Algebra 1, Student Edition, 9780079039897…
Algebra
ISBN:
9780079039897
Author:
Carter
Publisher:
McGraw Hill
Big Ideas Math A Bridge To Success Algebra 1: Stu…
Algebra
ISBN:
9781680331141
Author:
HOUGHTON MIFFLIN HARCOURT
Publisher:
Houghton Mifflin Harcourt