s Reported Annual Balance Sheet Ceport Date cale ash & temporary cash investments tore deposits in-transit Ceceivables ventory ssets held for sale repaid & other current assets otal current assets 2019 2018 2017 2016 Thousands 399,000 1,179,000 1,706,000 7,084,000 Thousands 322,000 910,000 1,649,000 6,561,000 0.00 Thousands Thousands 429,000 1,181,000 1,589,000 6,846,000 166,000 592,000 10,803,000 21,635,000 347,000 1,161,000 1,637,000 6,533,000 604,000 835,000 11,117,000 21,071,000 522,000 10,890,000 21,871,000 6,814,000 1,066,000 3,076,000 1,539,000 45,256,000 898,000 10,340,000 21,016,000 roperty, plant & equipment, net perating lease assets atangibles, net Foodwill ther assets otal assets iabilities urrent portion of long-term debt including obligations under fin urrent portion of long-term debt including obligations under ca current portion of operating lease liabilities rade accounts payable ccrued salaries & wages eferred income taxes 1,258,000 3,087,000 1,335,000 38,118,000 1,153,000 3,031,000 965,000 36,505,000 1,100,000 2.925.000 984,000 37,197,000 1,965,000 3,157,000 3,560,000 2,252,000 597,000 6,349,000 1.168.000 6,059,000 1,227,000 5,858,000 1,099,000 5,818,000 1,234,000 251,000 iabilities held for sale ather current liabilities 51,000 3,780,000 14,274,000 259,000 3,421,000 14,197,000 4,164,000 14,243,000 6,505,000 12,111,000 3,305,000 12,860,000 otal current liabilities oncurrent operating lease liabilities ong-term debt including obligations under finance leases ong-term debt including obligations under capital leases & fina eferred income taxes ension & postretirement benefit obligations ther long-term liabilities otal liabilities 12,072,000 1,562,000 494,000 1,881,000 30,283,000 12,029,000 1,568,000 792,000 1,706,000 30,292,000 11,825,000 1,927,000 1,524,000 1,659,000 29,795,000 1,466,000 608.000 1,750,000 36,683,000 Common shares dditional paid-in capital Accumulated other comprehensive income (loss) Cetained earnings (accumulated deficit) Common shares in treasury, at cost loncontrolling interests otal equity (deficit) dditional Information let cash flows from operating activities 1,918,000 3,337,000 (640,000) 20,978,000 16,991,000 (29,000) 8,573,000 1,918,000 3,245,000 (346,000) 19,681,000 16,612,000 (51,000) 7,835,000 1,918,000 3,161,000 (471,000) 17,007,000 14,684,000 (26,000) 6,905,000 1,918,000 3,070,000 (715,000) 15,543,000 13,118,000 12,000 6,710,000 4,664,000 3,299,000 12,553,000 3,413,000 3,201,000 12.072.000 4,164,000 3,254,000 12,245,000 14,277,000 10,306,000 2,716,000 1,066,000 43,864.000 4,272,000 3,197,000 11,643,000 13,495,000 9,342,000 1,979,000 932,000 40,588.000 and uildings & land improvements quipment easehold improvements Construction-in-progress eased property under capital leases & financing obligations otal property, plant & equipment Accumulated depreciation & amortization roperty, plant & equipment, net as Reported Annual Income Statement Ceport Date cale ales ost of sales 15.031.000 13,635,000 9,773,000 2,050,000 1,000,000 41,731,000 20,660,000 21,071,000 10,832,000 3,166,000 966.000 45,847,000 23,976,000 21,871,000 22,229,000 21,635,000 19,572,000 21,016,000 2019 2018 2017 Thousands Thousands 122,662,000 95,662,000 27,000,000 21,568,000 911,000 2,436,000 2,085,000 601,000 Thousands 122,286,000 Gross Profit perating, general & administrative Cent epreciation & amortization perating profit (loss) aterest expense lon-service component of company-sponsored pension plan c lark to market gain (loss) on Ocado International Holdings Limit Sain on sale of businesses let earnings before income tax expense (benefit) acome tax expense (benefit) et earnings after income tax expense (benefit) et earnings (loss) attributable to noncontrolling interests et earnings (loss) attributable to The Kroger Co. dditional Information 95,294,000 26,992,000 21,208,000 884,000 2,649,000 2,251,000 603,000 121,162,000 94,894,000 26,268,000 20,305,000 884,000 2,465,000 2,614,000 620,000 26,000 228,000 1,782,000 3,978,000 900,000 157,000 176,000 1,981,000 469,000 1,512,000 147,000 1,659,000 1,484,000 (405,000) 1,889,000 18,000 1,907,000 3,078,000 32,000 3,110,000 Veighted average shares outstanding - basic Veighted average shares outstanding - diluted ear end shares outstanding 799,000 805,000 788,000 810,000 818,000 798,000 895,000 904,000 870,000

Financial Accounting: The Impact on Decision Makers
10th Edition
ISBN:9781305654174
Author:Gary A. Porter, Curtis L. Norton
Publisher:Gary A. Porter, Curtis L. Norton
Chapter7: Receivables And Investments
Section: Chapter Questions
Problem 7.11E
icon
Related questions
Question

Find the asset turnover for years 2017, 2018, and 2019.

Kroger
As Reported Annual Balance Sheet
Report Date
2018
Thousands
2019
2017
2016
Scale
Thousands
Thousands
Thousands
Cash & temporary cash investments
Store deposits in-transit
Receivables
399,000
1,179,000
1,706,000
7,084,000
429,000
1,181,000
1,589,000
6.846.000
166,000
592,000
10,803,000
21,635,000
347,000
1,161,000
1,637,000
6.533,000
322,000
910,000
1,649,000
6,561,000
Inventory
604,000
835,000
11,117,000
21,071,000
Assets held for sale
0.00
522,000
10,890,000
21,871,000
898,000
10,340,000
21,016,000
Prepaid & other current assets
Total current assets
Property, plant & equipment, net
Operating lease assets
Intangibles, net
Goodwill
6,814,000
1,066,000
3,076,000
1,258,000
3,087,000
1,335,000
1,100,000
2,925,000
984,000
37,197,000
1,153,000
3,031,000
965,000
36,505,000
Other assets
1,539,000
Total assets
45,256,000
38,118,000
Liabilities
1,965,000
Current portion of long-term debt including obligations under fin
Current portion of long-term debt including obligations under ca
Current portion of operating lease liabilities
Trade accounts payable
Accrued salaries & wages
3,157,000
3,560,000
2,252,000
597,000
6,349,000
1,168,000
6,059,000
1,227,000
5,858,000
1,099,000
5,818,000
1,234,000
251.000
Deferred income taxes
Liabilities held for sale
51,000
3,780,000
14,274,000
259,000
3,421,000
14,197,000
3,305,000
12,860,000
Other current liabilities
Total current liabilities
Noncurrent operating lease liabilities
Long-term debt including obligations under finance leases
Long-term debt including obligations under capital leases & fina
Deferred income taxes
4,164,000
14,243,000
6,505,000
12,111,000
12,072,000
1,562,000
494,000
1,881,000
30,283,000
12,029,000
11,825,000
1,927,000
1,524,000
1,659,000
29,795,000
1,466,000
608,000
1,568,000
792,000
Pension & postretirement benefit obligations
Other long-term liabilities
1,750,000
36,683,000
1,706,000
Total liabilities
30,292,000
1.918,000
3,161,000
(471,000)
17,007,000
14,684,000
(26,000)
6,905,000
1,918,000
3,070,000
(715,000)
15,543,000
13,118,000
12,000
6,710,000
Common shares
1.918.000
1,918,000
3,245,000
(346,000)
19,681,000
16,612,000
(51,000)
7,835,000
Additional paid-in capital
3,337,000
(640,000)
20,978,000
16.991,000
Accumulated other comprehensive income (loss)
Retained earnings (accumulated deficit)
Common shares in treasury, at cost
Noncontrolling interests
Total equity (deficit)
Additional Information
Net cash flows from operating activities
Land
(29,000)
8,573,000
4,664,000
3,299,000
12,553,000
15,031,000
10,832,000
3,166,000
966,000
45,847,000
4,164,000
3,254,000
12,245,000
14,277,000
10,306,000
3,413,000
3,201,000
12,072,000
13,635,000
9,773,000
2,050,000
1,000,000
41,731,000
20,660,000
21,071,000
4.272.000
Buildings & land improvements
Equipment
Leasehold improvements
Construction-in-progress
Leased property under capital leases & financing obligations
Total property, plant & equipment
Accumulated depreciation & amortization
Property, plant & equipment, net
As Reported Annual Income Statement
Report Date
3,197,000
11,643,000
13,495,000
9,342,000
1,979,000
932,000
40,588,000
2,716,000
1,066,000
43,864,000
22,229,000
21,635,000
23,976,000
19.572.000
21,871,000
21,016,000
2019
2018
2017
Scale
Thousands
Thousands
Thousands
122,286,000
95,294,000
26,992,000
21,208,000
884,000
2,649,000
Sales
121,162,000
94,894,000
26,268,000
20,305,000
884,000
2,465,000
2,614,000
620,000
26,000
228,000
1,782,000
3,978,000
900,000
3,078,000
32,000
3,110,000
Cost of sales
122,662,000
95,662,000
27,000,000
21,568,000
911,000
2,436,000
2,085,000
601,000
Gross Profit
Operating, general & administrative
Rent
Depreciation & amortization
Operating profit (loss)
Interest expense
Non-service component of company-sponsored pension plan c
Mark to market gain (loss) on Ocado International Holdings Limit
2,251,000
603,000
157,000
176,000
1,981,000
469,000
1,512,000
Gain on sale of businesses
Net earnings before income tax expense (benefit)
Income tax expense (benefit)
Net earnings after income tax expense (benefit)
Net earnings (loss) attributable to noncontrolling interests
Net earnings (loss) attributable to The Kroger Co.
1,484,000
(405,000)
1,889,000
147,000
1,659,000
18,000
1,907,000
Additional Information
Weighted average shares outstanding - basic
Weighted average shares outstanding - diluted
Year end shares outstanding
799,000
805,000
788,000
810,000
818,000
798,000
895,000
904,000
870,000
Transcribed Image Text:Kroger As Reported Annual Balance Sheet Report Date 2018 Thousands 2019 2017 2016 Scale Thousands Thousands Thousands Cash & temporary cash investments Store deposits in-transit Receivables 399,000 1,179,000 1,706,000 7,084,000 429,000 1,181,000 1,589,000 6.846.000 166,000 592,000 10,803,000 21,635,000 347,000 1,161,000 1,637,000 6.533,000 322,000 910,000 1,649,000 6,561,000 Inventory 604,000 835,000 11,117,000 21,071,000 Assets held for sale 0.00 522,000 10,890,000 21,871,000 898,000 10,340,000 21,016,000 Prepaid & other current assets Total current assets Property, plant & equipment, net Operating lease assets Intangibles, net Goodwill 6,814,000 1,066,000 3,076,000 1,258,000 3,087,000 1,335,000 1,100,000 2,925,000 984,000 37,197,000 1,153,000 3,031,000 965,000 36,505,000 Other assets 1,539,000 Total assets 45,256,000 38,118,000 Liabilities 1,965,000 Current portion of long-term debt including obligations under fin Current portion of long-term debt including obligations under ca Current portion of operating lease liabilities Trade accounts payable Accrued salaries & wages 3,157,000 3,560,000 2,252,000 597,000 6,349,000 1,168,000 6,059,000 1,227,000 5,858,000 1,099,000 5,818,000 1,234,000 251.000 Deferred income taxes Liabilities held for sale 51,000 3,780,000 14,274,000 259,000 3,421,000 14,197,000 3,305,000 12,860,000 Other current liabilities Total current liabilities Noncurrent operating lease liabilities Long-term debt including obligations under finance leases Long-term debt including obligations under capital leases & fina Deferred income taxes 4,164,000 14,243,000 6,505,000 12,111,000 12,072,000 1,562,000 494,000 1,881,000 30,283,000 12,029,000 11,825,000 1,927,000 1,524,000 1,659,000 29,795,000 1,466,000 608,000 1,568,000 792,000 Pension & postretirement benefit obligations Other long-term liabilities 1,750,000 36,683,000 1,706,000 Total liabilities 30,292,000 1.918,000 3,161,000 (471,000) 17,007,000 14,684,000 (26,000) 6,905,000 1,918,000 3,070,000 (715,000) 15,543,000 13,118,000 12,000 6,710,000 Common shares 1.918.000 1,918,000 3,245,000 (346,000) 19,681,000 16,612,000 (51,000) 7,835,000 Additional paid-in capital 3,337,000 (640,000) 20,978,000 16.991,000 Accumulated other comprehensive income (loss) Retained earnings (accumulated deficit) Common shares in treasury, at cost Noncontrolling interests Total equity (deficit) Additional Information Net cash flows from operating activities Land (29,000) 8,573,000 4,664,000 3,299,000 12,553,000 15,031,000 10,832,000 3,166,000 966,000 45,847,000 4,164,000 3,254,000 12,245,000 14,277,000 10,306,000 3,413,000 3,201,000 12,072,000 13,635,000 9,773,000 2,050,000 1,000,000 41,731,000 20,660,000 21,071,000 4.272.000 Buildings & land improvements Equipment Leasehold improvements Construction-in-progress Leased property under capital leases & financing obligations Total property, plant & equipment Accumulated depreciation & amortization Property, plant & equipment, net As Reported Annual Income Statement Report Date 3,197,000 11,643,000 13,495,000 9,342,000 1,979,000 932,000 40,588,000 2,716,000 1,066,000 43,864,000 22,229,000 21,635,000 23,976,000 19.572.000 21,871,000 21,016,000 2019 2018 2017 Scale Thousands Thousands Thousands 122,286,000 95,294,000 26,992,000 21,208,000 884,000 2,649,000 Sales 121,162,000 94,894,000 26,268,000 20,305,000 884,000 2,465,000 2,614,000 620,000 26,000 228,000 1,782,000 3,978,000 900,000 3,078,000 32,000 3,110,000 Cost of sales 122,662,000 95,662,000 27,000,000 21,568,000 911,000 2,436,000 2,085,000 601,000 Gross Profit Operating, general & administrative Rent Depreciation & amortization Operating profit (loss) Interest expense Non-service component of company-sponsored pension plan c Mark to market gain (loss) on Ocado International Holdings Limit 2,251,000 603,000 157,000 176,000 1,981,000 469,000 1,512,000 Gain on sale of businesses Net earnings before income tax expense (benefit) Income tax expense (benefit) Net earnings after income tax expense (benefit) Net earnings (loss) attributable to noncontrolling interests Net earnings (loss) attributable to The Kroger Co. 1,484,000 (405,000) 1,889,000 147,000 1,659,000 18,000 1,907,000 Additional Information Weighted average shares outstanding - basic Weighted average shares outstanding - diluted Year end shares outstanding 799,000 805,000 788,000 810,000 818,000 798,000 895,000 904,000 870,000
Expert Solution
Step 1 Introduction

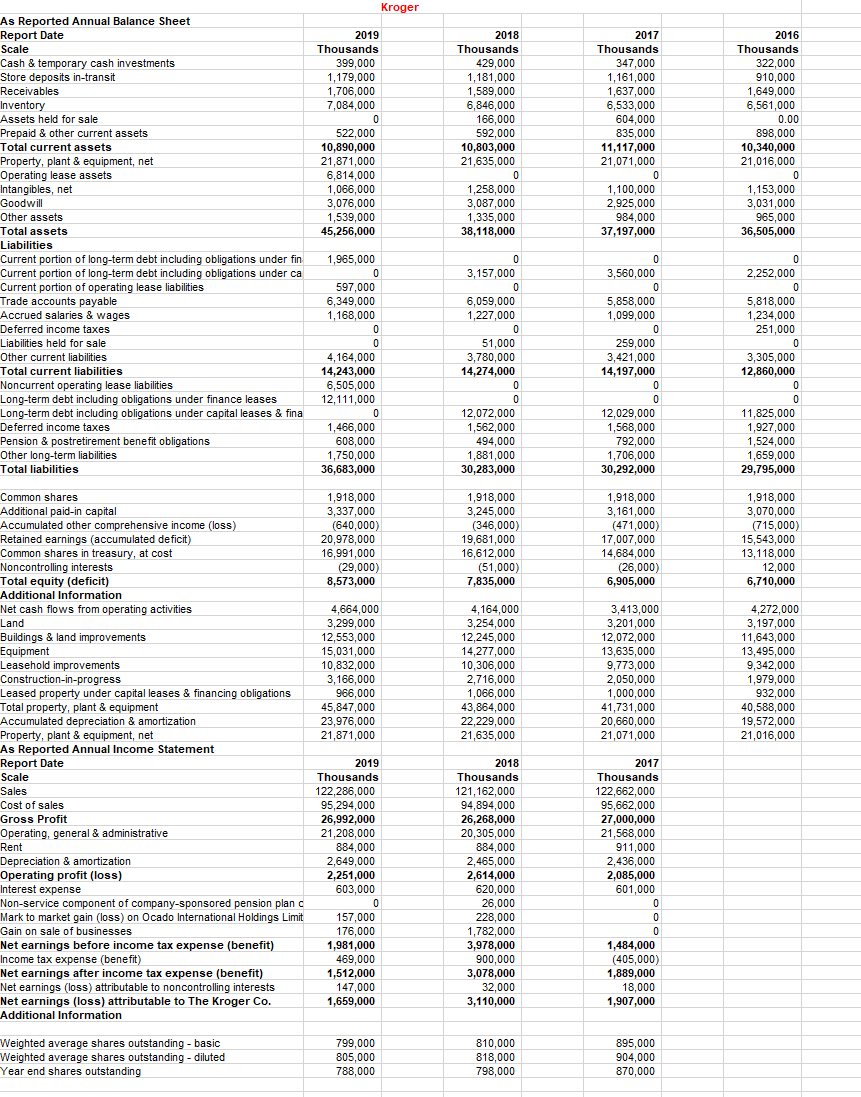
Assets turnover ratio is used to determine the company efficiency to use its total assets to generate the sale income during a year.

Assets turnover ratio is calculated as dividing net sales during year by average total assets. 

Step 2 Solution

Assets turnover ratio = Net sales / Average total assets

Average total assets = (Beginning Total assets + Ending total assets) / 2


Calculation of assets turnover for year 2017, 2018, 2019

Year 2017

Net sales= 122,662,000 thousands

Beginning total assets = 36,505,000 thousands

Ending total assets = 37,197,000 thousands

Average total assets = (36,505,000 + 37,197,000) / 2  =36,851,000 thousands

Assets turnover ratio = 122,662,000 / 36,851,000  =  3.33


Year 2018

Net sales=  121,162,000 thousands

Beginning total assets = 37,197,000  thousands

Ending total assets =38,118,000 thousands

Average total assets = (37,197,000 + 38,118,000) / 2  =37,657,500 thousands

Assets turnover ratio = 121,162,000 / 37,657,500 = 3.22


Year 2019

Net sales=  122,286,000 thousands

Beginning total assets = 38,118,000 thousands

Ending total assets = 45,256,000 thousands

Average total assets = (38,118,000 + 45,256,000) / 2  =83,374,000 thousands

Assets turnover ratio = 122,286,000 / 83,374,000 = 1.47


steps

Step by step

Solved in 3 steps

Blurred answer
Knowledge Booster
Events after the reporting period
Learn more about
Need a deep-dive on the concept behind this application? Look no further. Learn more about this topic, accounting and related others by exploring similar questions and additional content below.
Similar questions
  • SEE MORE QUESTIONS
Recommended textbooks for you
Financial Accounting: The Impact on Decision Make…
Accounting
ISBN:
9781305654174
Author:
Gary A. Porter, Curtis L. Norton
Publisher:
Cengage Learning
Cornerstones of Financial Accounting
Accounting
ISBN:
9781337690881
Author:
Jay Rich, Jeff Jones
Publisher:
Cengage Learning