Salary 2010 ($) 37,000 61,000 35,000 41,000 73,000 34,000 41,000 71,000 65,000 40,000 70,000 21,000 34,000 56,000 53,000 8,000 36,000 71,000 42,000 27,000 Salary 2008 ($) 52,000 44,000 31,000 51,000 55,000 40,000 28,000 55,000 59,000 37,000 61,000 38,000 52,000 49,000 50,000 59,000 55,000 61,000 48,000 46,000 Salary 2010 ($) 52,000 35,000 50,000 64,000 68,000 53,000 61,000 41,000 63,000 48,000 45,000 46,000 29,000 46,000 53,000 16,000 40,000 48,000 52,000 56,000 Salary 2008 ($) 35,000 56,000 53,000 52,000 50,000 46,000 60,000 45,000 50,000 43,000 66,000 52,000 39,000 47,000 39,000 41,000 58,000 42,000 56,000 52,000

Algebra & Trigonometry with Analytic Geometry
13th Edition
ISBN:9781133382119
Author:Swokowski
Publisher:Swokowski
Chapter10: Sequences, Series, And Probability
Section10.3: Geometric Sequences
Problem 81E
icon
Related questions
Topic Video
Question

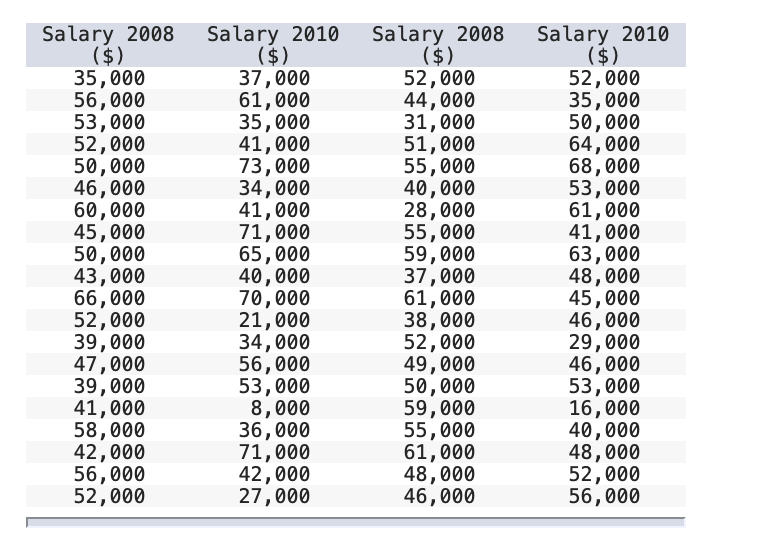
Recent evidence suggests that graduating from college during bad economic times can impact the graduate's earning power for a long time (Financial Times, June 1, 2012). An associate dean at a prestigious college wants to determine if the starting salary of his college graduates has declined from 2008 to 2010. He expects the variance of the salaries to be different between these two years. The data are shown in the accompanying table and are contained in the accompanying Excel file. (You may find it useful to reference the appropriate table: z table or t table)

Let Sample 1 be the sample of the starting salary of college graduates in 2008 and Sample 2 be the sample of the starting salary of college graduates in 2010.

a. Specify the competing hypotheses that determine whether the starting salary of college graduates has declined from 2008 to 2010.

(Which one is correct)

  • H0: μ1μ2 = 0; HA: μ1μ2 ≠ 0
  • H0: μ1μ2 ≥ 0; HA: μ1μ2 < 0
  • H0: μ1μ2 ≤ 0; HA: μ1μ2 > 0

b. Find the p-value.

  • p-value ≥ 0.10
  • 0.05 ≤p-value < 0.10
  • 0.025 ≤ p-value < 0.05
  • 0.01 ≤ p-value < 0.025
  • p-value < 0.01

c. At the 5% significance level, have salaries gone down from 2008 to 2010?

(Which one is correct)

  • Reject H0; there is evidence that the starting salary of college graduates has declined from 2008 to 2010.
  • Reject H0; there is not sufficient evidence that the starting salary of college graduates has declined from 2008 to 2010.
  • Do not reject H0; there is evidence that the starting salary of college graduates has declined from 2008 to 2010.
  • Do not reject H0; there is not sufficient evidence that the starting salary of college graduates has declined from 2008 to 2010.
Salary 2010
($)
37,000
61,000
35,000
41,000
73,000
34,000
41,000
71,000
65,000
40,000
70,000
21,000
34,000
56,000
53,000
8,000
36,000
71,000
42,000
27,000
Salary 2008
($)
52,000
44,000
31,000
51,000
55,000
40,000
28,000
55,000
59,000
37,000
61,000
38,000
52,000
49,000
50,000
59,000
55,000
61,000
48,000
46,000
Salary 2010
($)
52,000
35,000
50,000
64,000
68,000
53,000
61,000
41,000
63,000
48,000
45,000
46,000
29,000
46,000
53,000
16,000
40,000
48,000
52,000
56,000
Salary 2008
($)
35,000
56,000
53,000
52,000
50,000
46,000
60,000
45,000
50,000
43,000
66,000
52,000
39,000
47,000
39,000
41,000
58,000
42,000
56,000
52,000
Transcribed Image Text:Salary 2010 ($) 37,000 61,000 35,000 41,000 73,000 34,000 41,000 71,000 65,000 40,000 70,000 21,000 34,000 56,000 53,000 8,000 36,000 71,000 42,000 27,000 Salary 2008 ($) 52,000 44,000 31,000 51,000 55,000 40,000 28,000 55,000 59,000 37,000 61,000 38,000 52,000 49,000 50,000 59,000 55,000 61,000 48,000 46,000 Salary 2010 ($) 52,000 35,000 50,000 64,000 68,000 53,000 61,000 41,000 63,000 48,000 45,000 46,000 29,000 46,000 53,000 16,000 40,000 48,000 52,000 56,000 Salary 2008 ($) 35,000 56,000 53,000 52,000 50,000 46,000 60,000 45,000 50,000 43,000 66,000 52,000 39,000 47,000 39,000 41,000 58,000 42,000 56,000 52,000
Expert Solution
trending now

Trending now

This is a popular solution!

steps

Step by step

Solved in 3 steps with 1 images

Blurred answer
Knowledge Booster
Hypothesis Tests and Confidence Intervals for Means
Learn more about
Need a deep-dive on the concept behind this application? Look no further. Learn more about this topic, statistics and related others by exploring similar questions and additional content below.
Recommended textbooks for you
Algebra & Trigonometry with Analytic Geometry
Algebra
ISBN:
9781133382119
Author:
Swokowski
Publisher:
Cengage
Elementary Linear Algebra (MindTap Course List)
Algebra
ISBN:
9781305658004
Author:
Ron Larson
Publisher:
Cengage Learning
Functions and Change: A Modeling Approach to Coll…
Algebra
ISBN:
9781337111348
Author:
Bruce Crauder, Benny Evans, Alan Noell
Publisher:
Cengage Learning