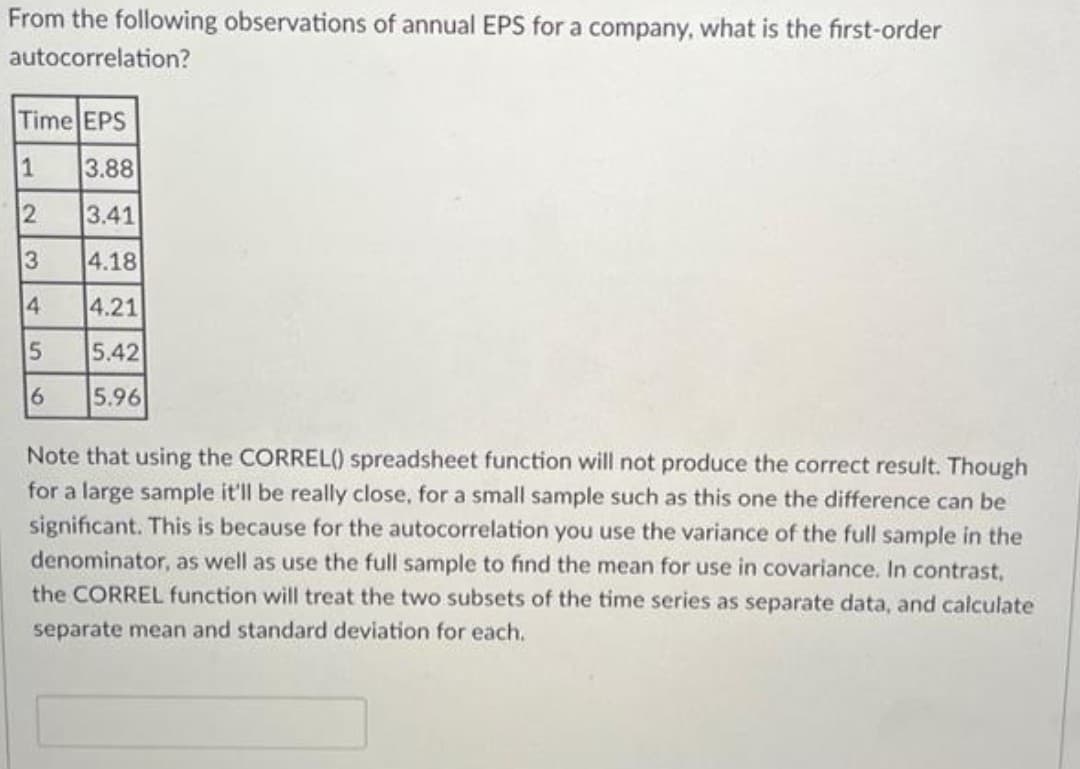
From the following observations of annual EPS for a company, what is the first-order autocorrelation? Time EPS 1 3.88 2 3.41 4.18 4.21 5.42 5.96 3 14 5 6 Note that using the CORREL() spreadsheet function will not produce the correct result. Though for a large sample it'll be really close, for a small sample such as this one the difference can be significant. This is because for the autocorrelation you use the variance of the full sample in the denominator, as well as use the full sample to find the mean for use in covariance. In contrast, the CORREL function will treat the two subsets of the time series as separate data, and calculate separate mean and standard deviation for each.
From the following observations of annual EPS for a company, what is the first-order autocorrelation? Time EPS 1 3.88 2 3.41 4.18 4.21 5.42 5.96 3 14 5 6 Note that using the CORREL() spreadsheet function will not produce the correct result. Though for a large sample it'll be really close, for a small sample such as this one the difference can be significant. This is because for the autocorrelation you use the variance of the full sample in the denominator, as well as use the full sample to find the mean for use in covariance. In contrast, the CORREL function will treat the two subsets of the time series as separate data, and calculate separate mean and standard deviation for each.

MATLAB: An Introduction with Applications
6th Edition
ISBN:9781119256830
Author:Amos Gilat
Publisher:Amos Gilat
Chapter1: Starting With Matlab
Section: Chapter Questions
Problem 1P

Related questions
Question
Transcribed Image Text:From the following observations of annual EPS for a company, what is the first-order
autocorrelation?
Time EPS
1
3.88
2
3.41
4.18
4.21
5.42
5.96
3
4
5
6
Note that using the CORREL() spreadsheet function will not produce the correct result. Though
for a large sample it'll be really close, for a small sample such as this one the difference can be
significant. This is because for the autocorrelation you use the variance of the full sample in the
denominator, as well as use the full sample to find the mean for use in covariance. In contrast,
the CORREL function will treat the two subsets of the time series as separate data, and calculate
separate mean and standard deviation for each.
Expert Solution
This question has been solved!
Explore an expertly crafted, step-by-step solution for a thorough understanding of key concepts.

Step by step
Solved in 2 steps

Recommended textbooks for you
MATLAB: An Introduction with Applications
Statistics
ISBN:
9781119256830
Author:
Amos Gilat
Publisher:
John Wiley & Sons Inc

Probability and Statistics for Engineering and th…
Statistics
ISBN:
9781305251809
Author:
Jay L. Devore
Publisher:
Cengage Learning

Statistics for The Behavioral Sciences (MindTap C…
Statistics
ISBN:
9781305504912
Author:
Frederick J Gravetter, Larry B. Wallnau
Publisher:
Cengage Learning
MATLAB: An Introduction with Applications
Statistics
ISBN:
9781119256830
Author:
Amos Gilat
Publisher:
John Wiley & Sons Inc
Probability and Statistics for Engineering and th…
Statistics
ISBN:
9781305251809
Author:
Jay L. Devore
Publisher:
Cengage Learning
Statistics for The Behavioral Sciences (MindTap C…
Statistics
ISBN:
9781305504912
Author:
Frederick J Gravetter, Larry B. Wallnau
Publisher:
Cengage Learning

Elementary Statistics: Picturing the World (7th E…
Statistics
ISBN:
9780134683416
Author:
Ron Larson, Betsy Farber
Publisher:
PEARSON

The Basic Practice of Statistics
Statistics
ISBN:
9781319042578
Author:
David S. Moore, William I. Notz, Michael A. Fligner
Publisher:
W. H. Freeman

Introduction to the Practice of Statistics
Statistics
ISBN:
9781319013387
Author:
David S. Moore, George P. McCabe, Bruce A. Craig
Publisher:
W. H. Freeman