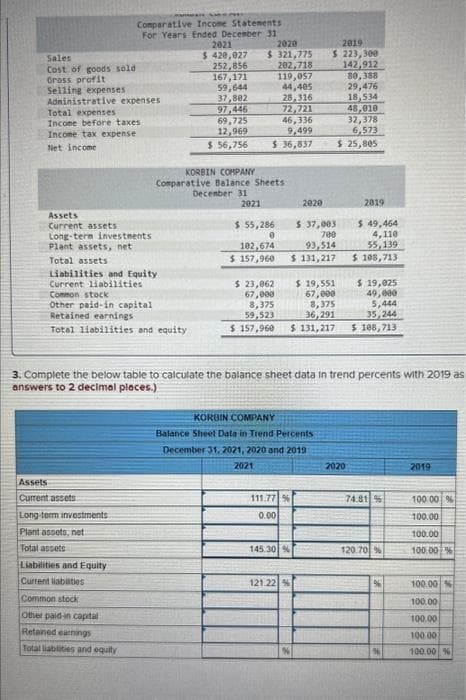
Sales Cost of goods sold Gross profit Selling expenses Administrative expenses Total expenses Income before taxes i Income tax expense Net income Comparative Income Statements For Years Ended December 31 Assets Current assets Long-term investments Plant assets, net Total assets Liabilities and Equity Current liabilities Common stock Other paid-in capital Retained earnings Total liabilities and equity ssets Current assets ong-term investments "lant assets, net otal assets iabilities and Equity Current liabaties Common stock 2021 $ 420,027 252,856 167,171 59,644 37,802 97,446 69,725 12,969 $ 56,756 KORBIN COMPANY Comparative Balance Sheets December 31 2020 $ 321,775 202,718 119,057 44,405 2021 28,316 72,721 46,336 9,499 $ 36,837 $ 55,286 0 102,674 $ 157,960 2020 111.77 % 0.00 145.30% 2019 $ 223,300 142,912 121.22 % $ 37,003 700 93,514 $ 131,217 KORBIN COMPANY Balance Sheet Data in Trend Percents December 31, 2021, 2020 and 2019 2021 48,010 32,378 6,573 $ 25,805 $ 19,551 67,000 8,375 36,291 $ 23,062 67,000 8,375 59,523 $ 157,960 $ 131,217 $ 108,713 Complete the below table to calculate the balance sheet data in trend percents with 2 swers to 2 decimal places.) 80,388 29,476 18,534 2019 2020 $ 49,464 4,110 55,139 $ 108,713 $ 19,025 49,000 5,444 35,244 74.81 % 120.70 % % 2019 100 100.0 100.0 100.0 100.0 100.C
Sales Cost of goods sold Gross profit Selling expenses Administrative expenses Total expenses Income before taxes i Income tax expense Net income Comparative Income Statements For Years Ended December 31 Assets Current assets Long-term investments Plant assets, net Total assets Liabilities and Equity Current liabilities Common stock Other paid-in capital Retained earnings Total liabilities and equity ssets Current assets ong-term investments "lant assets, net otal assets iabilities and Equity Current liabaties Common stock 2021 $ 420,027 252,856 167,171 59,644 37,802 97,446 69,725 12,969 $ 56,756 KORBIN COMPANY Comparative Balance Sheets December 31 2020 $ 321,775 202,718 119,057 44,405 2021 28,316 72,721 46,336 9,499 $ 36,837 $ 55,286 0 102,674 $ 157,960 2020 111.77 % 0.00 145.30% 2019 $ 223,300 142,912 121.22 % $ 37,003 700 93,514 $ 131,217 KORBIN COMPANY Balance Sheet Data in Trend Percents December 31, 2021, 2020 and 2019 2021 48,010 32,378 6,573 $ 25,805 $ 19,551 67,000 8,375 36,291 $ 23,062 67,000 8,375 59,523 $ 157,960 $ 131,217 $ 108,713 Complete the below table to calculate the balance sheet data in trend percents with 2 swers to 2 decimal places.) 80,388 29,476 18,534 2019 2020 $ 49,464 4,110 55,139 $ 108,713 $ 19,025 49,000 5,444 35,244 74.81 % 120.70 % % 2019 100 100.0 100.0 100.0 100.0 100.C
Financial Accounting: The Impact on Decision Makers
10th Edition
ISBN:9781305654174
Author:Gary A. Porter, Curtis L. Norton
Publisher:Gary A. Porter, Curtis L. Norton
Chapter2: Financial Statements And The Annual Report
Section: Chapter Questions
Problem 2.13MCE
Related questions
Question

Transcribed Image Text:Sales
Cost of goods sold
Gross profit
Selling expenses
Administrative expenses
Total expenses
Income before taxes.
Income tax expense
Net income
Assets
Current assets
Long-term investments
Plant assets, net
Total assets
Sin
Comparative Income Statements
For Years Ended December 31
2021
$ 420,027
252,856
167,171
59,644
37,802
97,446
69,725
12,969
$ 56,756
Liabilities and Equity
Current liabilities
Common stock
Other paid-in capital
Retained earnings
Total liabilities and equity
Assets
Current assets
Long-term investments
Plant assets, net.
Total assets
Liabilities and Equity
Current liabaties
Common stock
Other paid-in capital
Retained earnings
Total liabilities and equity
2020
$ 321,775
202,718
KORBIN COMPANY
Comparative Balance Sheets
December 31
2021
119,057
44,405
28,316
72,721
46,336
9,499
$ 36,837
$ 55,286
0
102,674
$ 157,960
2020
3. Complete the below table to calculate the balance sheet data in trend percents with 2019 as
answers to 2 decimal places.)
111.77 %
0.00
$ 37,003
700
93,514
$ 131,217
KORBIN COMPANY
Balance Sheet Data in Trend Percents
December 31, 2021, 2020 and 2019
2021
2019
$ 223,300
142,912
145.30%
121.22 %
$ 19,551
$ 23,062
67,000
8,375
67,000
8,375
36,291
5,444
59,523
35,244
$ 157,960 $ 131,217 $ 108,713
80,388
29,476
18,534
48,010
32,378
6,573
$ 25,805
2819
$ 49,464
4,110
55,139
$ 108,713
$ 19,025
49,000
2020
74.81 %
120.70 %
%
2019
100.00 %
100.00
100.00
100.00 %
100.00
100.00
100.00
100.00
100.00 %
Expert Solution
This question has been solved!
Explore an expertly crafted, step-by-step solution for a thorough understanding of key concepts.
This is a popular solution!
Trending now
This is a popular solution!
Step by step
Solved in 2 steps

Knowledge Booster
Learn more about
Need a deep-dive on the concept behind this application? Look no further. Learn more about this topic, accounting and related others by exploring similar questions and additional content below.Recommended textbooks for you

Financial Accounting: The Impact on Decision Make…
Accounting
ISBN:
9781305654174
Author:
Gary A. Porter, Curtis L. Norton
Publisher:
Cengage Learning

Financial And Managerial Accounting
Accounting
ISBN:
9781337902663
Author:
WARREN, Carl S.
Publisher:
Cengage Learning,

College Accounting (Book Only): A Career Approach
Accounting
ISBN:
9781337280570
Author:
Scott, Cathy J.
Publisher:
South-Western College Pub

Financial Accounting: The Impact on Decision Make…
Accounting
ISBN:
9781305654174
Author:
Gary A. Porter, Curtis L. Norton
Publisher:
Cengage Learning

Financial And Managerial Accounting
Accounting
ISBN:
9781337902663
Author:
WARREN, Carl S.
Publisher:
Cengage Learning,

College Accounting (Book Only): A Career Approach
Accounting
ISBN:
9781337280570
Author:
Scott, Cathy J.
Publisher:
South-Western College Pub

College Accounting (Book Only): A Career Approach
Accounting
ISBN:
9781305084087
Author:
Cathy J. Scott
Publisher:
Cengage Learning

Cornerstones of Financial Accounting
Accounting
ISBN:
9781337690881
Author:
Jay Rich, Jeff Jones
Publisher:
Cengage Learning

Fundamentals of Financial Management (MindTap Cou…
Finance
ISBN:
9781337395250
Author:
Eugene F. Brigham, Joel F. Houston
Publisher:
Cengage Learning