Sales Inventories at 1 July 2021 Raw materials Work in process Finished goods Inventories at 30 June 2022 Raw materials Work in process Finished goods Direct material used Purchases of raw materials Direct labour. Actual manufacturing overhead Selling and administrative expenses Total manufacturing costs Cost of goods manufactured Cost of goods available for sale Cost of goods sold Gross profit Net profit $ 4,625,000 300,000 175,000 250,000 400,000 150,000 150,000 475,000 575,000 1,125,000 2,238,750 0 3,850,000 3,875,000 4,125,000 3,963,750 661,250 661,250
Sales Inventories at 1 July 2021 Raw materials Work in process Finished goods Inventories at 30 June 2022 Raw materials Work in process Finished goods Direct material used Purchases of raw materials Direct labour. Actual manufacturing overhead Selling and administrative expenses Total manufacturing costs Cost of goods manufactured Cost of goods available for sale Cost of goods sold Gross profit Net profit $ 4,625,000 300,000 175,000 250,000 400,000 150,000 150,000 475,000 575,000 1,125,000 2,238,750 0 3,850,000 3,875,000 4,125,000 3,963,750 661,250 661,250

Managerial Accounting
15th Edition
ISBN:9781337912020
Author:Carl Warren, Ph.d. Cma William B. Tayler
Publisher:Carl Warren, Ph.d. Cma William B. Tayler
Chapter1: Introduction To Managerial Accounting
Section: Chapter Questions
Problem 5PA: Statement of cost of goods manufactured and income statement for a manufacturing company The...

Related questions
Question
Calculate the amounts to be charged to work in process, finished goods inventory and cost of goods sold for the Fertiliser Division at the end of 30 June 2022 if proration method is used.
Prepare the necessary
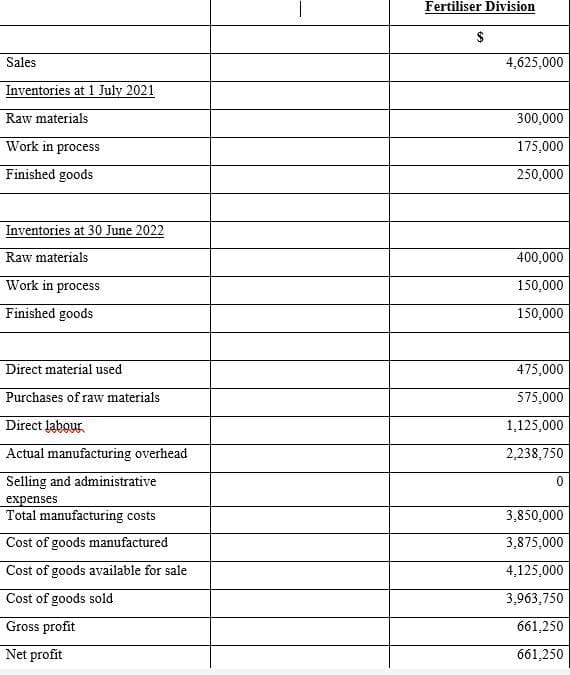
Transcribed Image Text:Sales
Inventories at 1 July 2021
Raw materials
Work in process
Finished goods
Inventories at 30 June 2022
Raw materials
Work in process
Finished goods
Direct material used
Purchases of raw materials
Direct labour
Actual manufacturing overhead
Selling and administrative
expenses
Total manufacturing costs
Cost of goods manufactured
Cost of goods available for sale
Cost of goods sold
Gross profit
Net profit
Fertiliser Division
$
4,625,000
300,000
175,000
250,000
400,000
150,000
150,000
475,000
575,000
1,125,000
2,238,750
0
3,850,000
3,875,000
4,125,000
3,963,750
661,250
661,250
Expert Solution
This question has been solved!
Explore an expertly crafted, step-by-step solution for a thorough understanding of key concepts.

Step by step
Solved in 2 steps with 3 images

Knowledge Booster


Learn more about
Need a deep-dive on the concept behind this application? Look no further. Learn more about this topic, accounting and related others by exploring similar questions and additional content below.Recommended textbooks for you
Managerial Accounting
Accounting
ISBN:
9781337912020
Author:
Carl Warren, Ph.d. Cma William B. Tayler
Publisher:
South-Western College Pub

Financial And Managerial Accounting
Accounting
ISBN:
9781337902663
Author:
WARREN, Carl S.
Publisher:
Cengage Learning,

College Accounting, Chapters 1-27
Accounting
ISBN:
9781337794756
Author:
HEINTZ, James A.
Publisher:
Cengage Learning,
Managerial Accounting
Accounting
ISBN:
9781337912020
Author:
Carl Warren, Ph.d. Cma William B. Tayler
Publisher:
South-Western College Pub
Financial And Managerial Accounting
Accounting
ISBN:
9781337902663
Author:
WARREN, Carl S.
Publisher:
Cengage Learning,
College Accounting, Chapters 1-27
Accounting
ISBN:
9781337794756
Author:
HEINTZ, James A.
Publisher:
Cengage Learning,

Accounting
Accounting
ISBN:
9781337272094
Author:
WARREN, Carl S., Reeve, James M., Duchac, Jonathan E.
Publisher:
Cengage Learning,