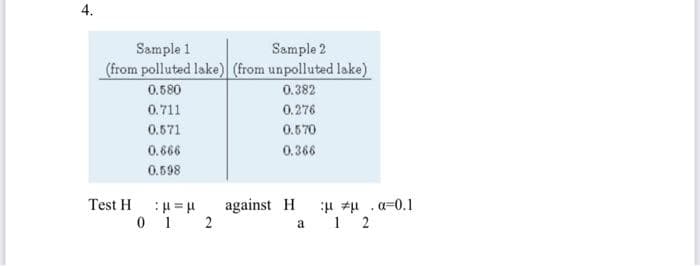
Sample 1 Sample 2 (from polluted lake) (from unpolluted lake) 0.580 0.382 0.711 0.276 0.571 0.570 0.366 0.666 0.598 Test Hμμ 0 1 2 against Hμμ .a-0.1 a 12
Q: Consider the following sets of sample data: A: 21,851, 20,126, 21,283, 21,675, 21,987, 21,046,…
A: Given data set for…
Q: Use the normal distribution to find a confidence interval for a difference in proportions p₁ - P2…
A: From the provided information,
Q: Compute the test statistic. Please show your work. 12pt BIUA Paragraph Y ▾ Y Y LE X !!! fami 111…
A: from given data We have : For first treatment group : n1=31, Mean of first treatment group = x1=32,…
Q: Social Networking Sites In a survey of 2255 randomly selected US adults (age 18 or older), 1787 of…
A: Given that Sample size (n)=2255 The number of US adults use internet regularly=1787 The number of US…
Q: Find the 1st quartile.
A: It is given that the data in stem and leaf plot form represents the terms in minutes required for 26…
Q: You wish to test the following claim (Ha) at a significance level of α=0.005. Ho:μ=55.9…
A: Given α=0.005,μ=55.9, n=21, M=60.1, s=13.6
Q: A genetic experiment with peas resulted in one sample of offspring that consisted of 429 green peas…
A: We have given thatn = 429x = 151p̂ = x/n = 151/429 = 0.3520 Confidence level (c) = 90% = 0.90α = 1 -…
Q: Beth wants to determine a 99% confidence interval for the true proportion of high school students in…
A: Suppose p is the true proportion of high school students in that area who attend their home…
Q: The mean daily production of a herd of cows is assumed to be normally distributed with a mean of 40…
A: Given that The mean daily production of a herd of cows is assumed to be normally distributed with a…
Q: Calculate the 5 numbers summary of the given data using approximation method.…
A:
Q: If all colors are equally likely, how many candies of each color (in a bag of 420 candies) would we…
A: It is given that Number of candies in a bag = 420 Type of candies = 6
Q: The mean age when smokers first start is 13 years old with a population standard deviation of 2…
A: We have given that Population mean (µ) = 13Standard deviations (σ) = 2Sample size (n) = 34Sample…
Q: Four salesman were posted in difference areas by a company. The number of units of commodity x sold…
A: Given: Test-statistic F = 3.89 Rejection region: If Test-statistic > Critical value, Reject H0.
Q: Construct an 80% confidence interval about μ if the sample size, n, is 13. (b) Construct an 80%…
A: It is given that Sample mean = 113 Sample standard deviation = 10 Note: According to Bartleby…
Q: Three potential employees took an aptitude test. Each person took a different version of the test.…
A: From the provided information, Pierce got a score of 71.5 with mean (µ) = 62.5 and standard…
Q: In the country of United States of Heightlandia, the height measurements of ten-year-old children…
A: GivenMean(μ)=55.1standard deviation(σ)=6.1
Q: For a x²-curve with 20 degrees of freedom, find the x²-value that has area 0.95 to its right. Click…
A: Given that Degree of freedom =df =20 Area =0.95
Q: To investigate the fluid mechanics of swimming, twenty swimmers each swam a specified distance in a…
A: Given that We have to find t test statistic and p value
Q: There are three dice rolled at the same time. b. How many possible outcomes are there if the desired…
A:
Q: Determine the area under the standard normal curve that lies between (a) Z=−0.09 and Z=0.09, (b)…
A: It is given that the z-scores. Here, need to find out the area between these z-scores.
Q: Twenty years ago 51% of parents of children in high school felt it was a serious problem that high…
A: Given Information: Twenty years ago, 51% of parents of children in high school felt it was a problem…
Q: population standard deviation is equal to 7.68 and the sample size is 117, what is the margin of…
A: Given S=7.68 n=117
Q: A therapist was interested in determining whether patients experiences reduced anxiety following…
A: Sample size N = 9 We have to use repeated samples t-test.
Q: Test the claim about the population mean, p, at the given level of significance using the given…
A: Given that Sample size n =68 Sample mean =48.6 Population standard deviation =3.15
Q: The recidivism rate for convicted sex offenders is 15%. A warden suspects that this percent is…
A: Given that Population proportion=0.15 Sample size (n)=381 Number of them repeat offender (X)=46…
Q: Could you please explain what the symbols I have circled mean? I need a little more help…
A: Level of significance is also known as alpha. It explains the probability that an observation…
Q: You wish to test the following claim (HaHa) at a significance level of α=0.002α=0.002.…
A: Given that size n=17 with mean M=91.5 and a standard deviation of SD=11.5.
Q: how many water specimens are required in the sample
A: It is given that Population standard deviation, σ = 3.2 Margin of error, E = 2 Confidence interval…
Q: A company claims that the mean monthly residential electricity consumption in a certain region is…
A: Given that Sample size n =69 Sample mean =900 Population standard deviation =121
Q: The following table shows the systolic blood pressure of 5 women and 5 men. Women 110 120 95…
A: As per our guidelines we are supposed to answer only 3 sub-parts of any questions so i am solving…
Q: Complete the following probability distribution if P(6) equals two-thirds of P(4) Give the values of…
A: Hello! As you have posted 2 different questions, we are answering the first question. In case you…
Q: tionnaire and administered it to a group of city dwellers and a group of country dwellers. Each city…
A: Rural Men Urban Men 22 25 19 23 18 20 17 18 15 12 10 9 6 4 4 3
Q: Assume that adults have IQ scores that are normally distributed with a mean of μ=105 and a standard…
A:
Q: Use a t-test to test the claim about the population mean u at the given level of significance a…
A: Solution: Given information: n=20 Sample size x=51527 Sample mean s=2800 Sample standard deviation
Q: Test the independence of the two variables in the table below: Enter the test statistic (to 4…
A: Solution: The observed count table is Yes No Row Total Happy 40 80 120 Sad 120 200 320…
Q: A researcher studied the relationship between the number of times a certain species of cricket will…
A: The future value estimated based on the another variable is known as prediction. The prediction can…
Q: Tire wear: An automobile manufacturer wants to compare the lifetimes of two brands of tires. She…
A: Suppose μd is the difference of mean lifetime o Brand A and Brand B tires.
Q: The continuous random variable X has the probability density function (pdf) given by: [k-5+x S(x) =…
A:
Q: n a recent poll, 500 people were asked if they liked dogs, and 94% said they did. Find the margin of…
A: Given data,No of people n=500p=94%=0.94Find the margin of error of this poll, at the 90% confidence…
Q: The following table shows crashworthiness ratings for 16 cars. (3 = Good, 2 = Acceptable, 1 =…
A: Probability: Probability is the measurement of the probability that an event will occur in a Random…
Q: From the population of 540, a sample of 60 induvidual is taken from this sample. Tge mean is found…
A: Given: Population size, N is 540 Sample size, n is 60 Sample mean, x¯ is 6.2 Sample standard…
Q: 2 For a x²-curve with 17 degrees of freedom, find X0.975 Click the icon to view a x²-table. The…
A:
Q: A researcher studied the relationship between the number of times a certain species of cricket will…
A: Regression line are used to predict the future value. It has two variables, they are independent and…
Q: 4) Let X₁, X₂, X, be mutually independent and identically distributed continuous random variables…
A:
Q: Find the total of the areas under the standard normal curve to the left of z1 and to the right of…
A: Here, z1=−1.78 and z2 = 1.78.
Q: Which of these statements is true? Group of answer choices The p-value is determined by the test…
A: It is given that. Comparison between p-value and test statistic.
Q: You wish to test the following claim (HaHa) at a significance level of α=0.005α=0.005.…
A: Given that Sample size n=18 M=84 and a standard deviation of SD=10.6
Q: Researchers studied the bone mineral density (BMD) and depression of men aged 65 to 92 years. At the…
A: Chi-square distribution : A probability density function that, among other things, has the property…
Q: Hi! I just need Part #4 and #5. The following table shows the systolic blood pressure of 5 women…
A: Given that The following table shows the systolic blood pressure of 5 women and 5 men. Women…
Q: To estmate the mean number of days a stock has positive daily increases within a year, business…
A: It is given that Population standard deviation, σ = 5.81 Margin of error, E = 1.66
test the hypothesis.
Step by step
Solved in 5 steps