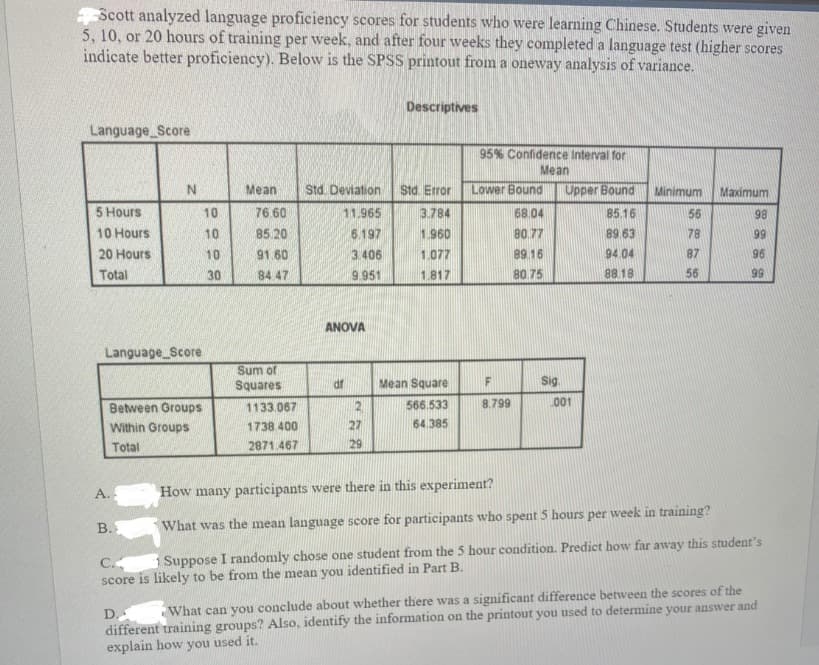
Scott analyzed language proficiency scores for students who were learning Chinese. Students were given 5, 10, or 20 hours of training per week, and after four weeks they completed a language test (higher scores indicate better proficiency). Below is the SPSS printout from a oneway analysis of variance. Descriptives Language Score 95% Confidence Interval for Mean Mean Std. Deviation Std. Error Lower Bound Upper Bound Minimum Maximum 5 Hours 10 76.60 11.965 3.784 68.04 85.16 56 98 10 Hours 10 85.20 6.197 1.960 80 77 89.63 78 99 20 Hours 10 91 60 3.406 1.077 89.16 94.04 87 96 Total 30 84 47 9.951 1.817 80.75 88.18 56 99 ANOVA Language_Score Sum of Squares df Mean Square Sig. Between Groups 1133.067 2. 566.533 8.799 001 Within Groups 1738.400 27 64.385 Total 2871.467 29 A. How many participants were there in this experiment? B. What was the mean language score for participants who spent 5 hours per week in training? i Suppose I randomly chose one student from the 5 hour condition. Predict how far away this student's C. score is likely to be from the mean you identified in Part B. D. different training groups? Also, identify the information on the printout you used to determine your answer and explain how you used it. What can you conclude about whether there was a significant difference between the scores of the
Scott analyzed language proficiency scores for students who were learning Chinese. Students were given 5, 10, or 20 hours of training per week, and after four weeks they completed a language test (higher scores indicate better proficiency). Below is the SPSS printout from a oneway analysis of variance. Descriptives Language Score 95% Confidence Interval for Mean Mean Std. Deviation Std. Error Lower Bound Upper Bound Minimum Maximum 5 Hours 10 76.60 11.965 3.784 68.04 85.16 56 98 10 Hours 10 85.20 6.197 1.960 80 77 89.63 78 99 20 Hours 10 91 60 3.406 1.077 89.16 94.04 87 96 Total 30 84 47 9.951 1.817 80.75 88.18 56 99 ANOVA Language_Score Sum of Squares df Mean Square Sig. Between Groups 1133.067 2. 566.533 8.799 001 Within Groups 1738.400 27 64.385 Total 2871.467 29 A. How many participants were there in this experiment? B. What was the mean language score for participants who spent 5 hours per week in training? i Suppose I randomly chose one student from the 5 hour condition. Predict how far away this student's C. score is likely to be from the mean you identified in Part B. D. different training groups? Also, identify the information on the printout you used to determine your answer and explain how you used it. What can you conclude about whether there was a significant difference between the scores of the

Glencoe Algebra 1, Student Edition, 9780079039897, 0079039898, 2018
18th Edition
ISBN:9780079039897
Author:Carter
Publisher:Carter
Chapter10: Statistics
Section10.3: Measures Of Spread
Problem 1GP

Related questions
Question
(I am reposting because I just need the answer to part D now, and was told to post it seperately after getting the answers to the rest of it.)
Transcribed Image Text:Scott analyzed language proficiency scores for students who were learning Chinese. Students were given
5, 10, or 20 hours of training per week, and after four weeks they completed a language test (higher scores
indicate better proficiency). Below is the SPSS printout from a oneway analysis of variance.
Descriptives
Language Score
95% Confidence Interval for
Mean
N.
Mean
Std Deviation
Std. Error
Lower Bound
Upper Bound
Minimum
Maximum
5 Hours
10
76.60
11.965
3.784
68.04
85.16
56
98
10 Hours
10
85.20
6.197
1.960
80 77
89 63
78
99
20 Hours
10
91 60
3.406
1.077
89 16
94.04
87
96
Total
30
84 47
9.951
1.817
80.75
88 18
56
99
ANOVA
Language_Score
Sum of
Squares
df
Mean Square
Sig.
Between Groups
1133.067
566.533
8.799
001
Within Groups
1738 400
27
64.385
Total
2871.467
29
A.
How many participants were there in this experiment?
В.
What was the mean language score for participants who spent 5 hours per week in training?
1 Suppose I randomly chose one student from the 5 hour condition. Predict how far away this student's
C.
score is likely to be from the mean you identified in Part B.
D.
different training groups? Also, identify the information on the printout you used to determine your answer and
explain how you used it.
What can you conclude about whether there was a significant difference between the scores of the
Expert Solution
This question has been solved!
Explore an expertly crafted, step-by-step solution for a thorough understanding of key concepts.

Step by step
Solved in 2 steps with 2 images

Recommended textbooks for you
Glencoe Algebra 1, Student Edition, 9780079039897…
Algebra
ISBN:
9780079039897
Author:
Carter
Publisher:
McGraw Hill

College Algebra (MindTap Course List)
Algebra
ISBN:
9781305652231
Author:
R. David Gustafson, Jeff Hughes
Publisher:
Cengage Learning
Glencoe Algebra 1, Student Edition, 9780079039897…
Algebra
ISBN:
9780079039897
Author:
Carter
Publisher:
McGraw Hill
College Algebra (MindTap Course List)
Algebra
ISBN:
9781305652231
Author:
R. David Gustafson, Jeff Hughes
Publisher:
Cengage Learning