Sean and Yvette Durand live in Detroit and enjoy going out to fancy restaurants for dinner and to diners for breakfast. On the follow purple curves ₁ and 12 represent two of their indifference curves for fancy dinners and diner breakfasts. They have $1,000 per mo spend on eating out. The price of a diner breakfast is always $10. Each labeled point represents the tangency between a budget con corresponding indifference curve. N 70 CO
Sean and Yvette Durand live in Detroit and enjoy going out to fancy restaurants for dinner and to diners for breakfast. On the follow purple curves ₁ and 12 represent two of their indifference curves for fancy dinners and diner breakfasts. They have $1,000 per mo spend on eating out. The price of a diner breakfast is always $10. Each labeled point represents the tangency between a budget con corresponding indifference curve. N 70 CO

Chapter3: Preferences And Utility
Section: Chapter Questions
Problem 3.4P

Related questions

Question
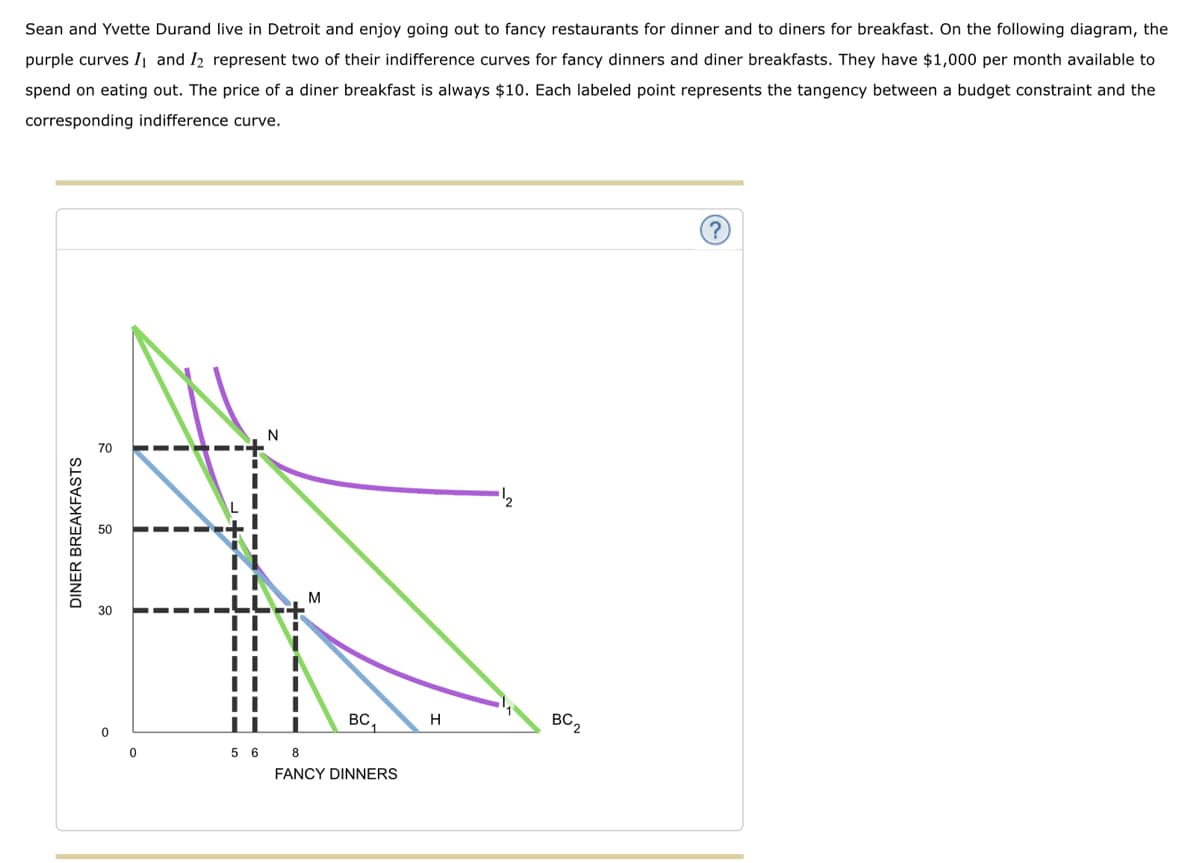
Transcribed Image Text:Sean and Yvette Durand live in Detroit and enjoy going out to fancy restaurants for dinner and to diners for breakfast. On the following diagram, the
purple curves ₁ and 12 represent two of their indifference curves for fancy dinners and diner breakfasts. They have $1,000 per month available to
spend on eating out. The price of a diner breakfast is always $10. Each labeled point represents the tangency between a budget constraint and the
corresponding indifference curve.
N
▬▬▬▬▬▬▬▬▬
DINER BREAKFASTS
0
5 6
M
BC₁
8
FANCY DINNERS
H
BC2
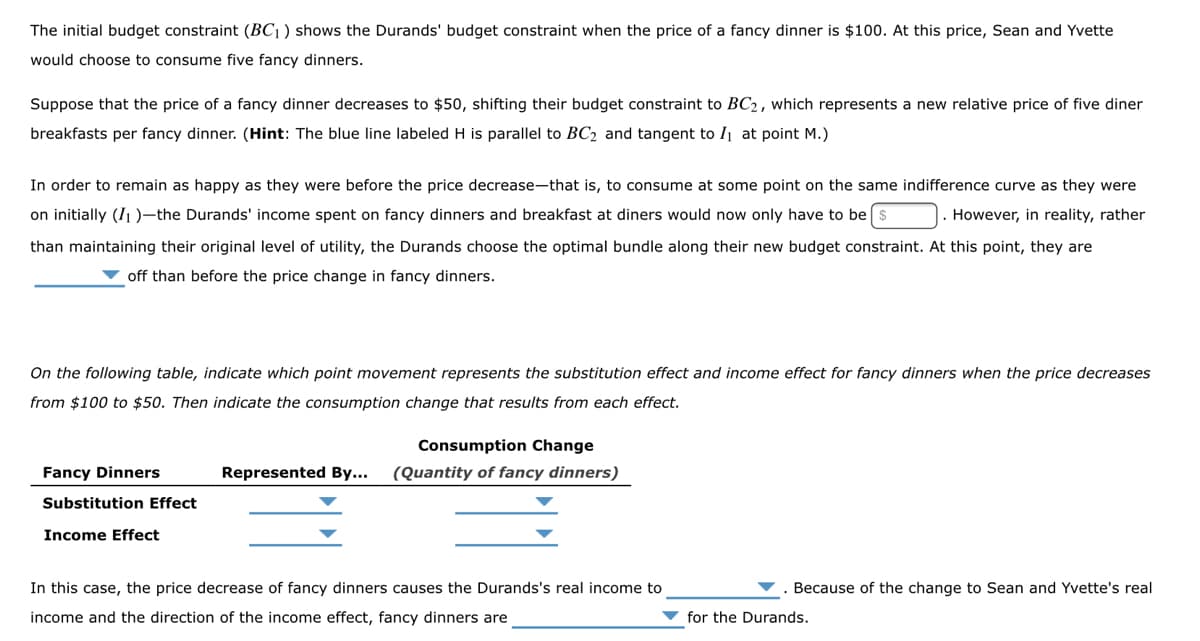
Transcribed Image Text:The initial budget constraint (BC₁) shows the Durands' budget constraint when the price of a fancy dinner is $100. At this price, Sean and Yvette
would choose to consume five fancy dinners.
Suppose that the price of a fancy dinner decreases to $50, shifting their budget constraint to BC₂, which represents a new relative price of five diner
breakfasts per fancy dinner. (Hint: The blue line labeled H is parallel to BC₂ and tangent to I₁ at point M.)
In order to remain as happy as they were before the price decrease-that is, to consume at some point on the same indifference curve as they were
on initially (1₁)-the Durands' income spent on fancy dinners and breakfast at diners would now only have to be $
However, in reality, rather
than maintaining their original level of utility, the Durands choose the optimal bundle along their new budget constraint. At this point, they are
off than before the price change in fancy dinners.
On the following table, indicate which point movement represents the substitution effect and income effect for fancy dinners when the price decreases
from $100 to $50. Then indicate the consumption change that results from each effect.
Consumption Change
Represented By... (Quantity of fancy dinners)
Fancy Dinners
Substitution Effect
Income Effect
In this case, the price decrease of fancy dinners causes the Durands's real income to
income and the direction of the income effect, fancy dinners are
Because of the change to Sean and Yvette's real
for the Durands.
Expert Solution
This question has been solved!
Explore an expertly crafted, step-by-step solution for a thorough understanding of key concepts.

Step by step
Solved in 2 steps

Knowledge Booster


Learn more about
Need a deep-dive on the concept behind this application? Look no further. Learn more about this topic, economics and related others by exploring similar questions and additional content below.Recommended textbooks for you

Microeconomics: Principles & Policy
Economics
ISBN:
9781337794992
Author:
William J. Baumol, Alan S. Blinder, John L. Solow
Publisher:
Cengage Learning

Exploring Economics
Economics
ISBN:
9781544336329
Author:
Robert L. Sexton
Publisher:
SAGE Publications, Inc
Microeconomics: Principles & Policy
Economics
ISBN:
9781337794992
Author:
William J. Baumol, Alan S. Blinder, John L. Solow
Publisher:
Cengage Learning
Exploring Economics
Economics
ISBN:
9781544336329
Author:
Robert L. Sexton
Publisher:
SAGE Publications, Inc

Principles of Microeconomics
Economics
ISBN:
9781305156050
Author:
N. Gregory Mankiw
Publisher:
Cengage Learning

