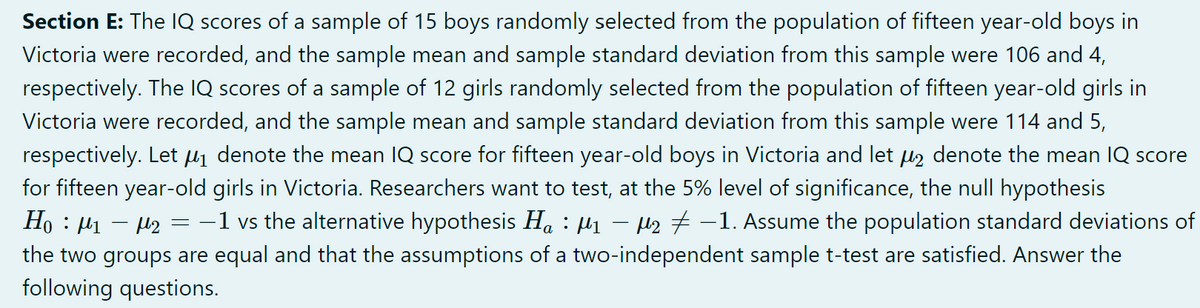
Section E: The IQ scores of a sample of 15 boys randomly selected from the population of fifteen year-old boys in Victoria were recorded, and the sample mean and sample standard deviation from this sample were 106 and 4, respectively. The IQ scores of a sample of 12 girls randomly selected from the population of fifteen year-old girls in Victoria were recorded, and the sample mean and sample standard deviation from this sample were 114 and 5, respectively. Let μ₁ denote the mean IQ score for fifteen year-old boys in Victoria and let μ2 denote the mean IQ score for fifteen year-old girls in Victoria. Researchers want to test, at the 5% level of significance, the null hypothesis H₁ M₁ M₂ = -1 vs the alternative hypothesis Ha ₁ - μ₂-1. Assume the population standard deviations of the two groups are equal and that the assumptions of a two-independent sample t-test are satisfied. Answer the following questions.
Section E: The IQ scores of a sample of 15 boys randomly selected from the population of fifteen year-old boys in Victoria were recorded, and the sample mean and sample standard deviation from this sample were 106 and 4, respectively. The IQ scores of a sample of 12 girls randomly selected from the population of fifteen year-old girls in Victoria were recorded, and the sample mean and sample standard deviation from this sample were 114 and 5, respectively. Let μ₁ denote the mean IQ score for fifteen year-old boys in Victoria and let μ2 denote the mean IQ score for fifteen year-old girls in Victoria. Researchers want to test, at the 5% level of significance, the null hypothesis H₁ M₁ M₂ = -1 vs the alternative hypothesis Ha ₁ - μ₂-1. Assume the population standard deviations of the two groups are equal and that the assumptions of a two-independent sample t-test are satisfied. Answer the following questions.

Functions and Change: A Modeling Approach to College Algebra (MindTap Course List)
6th Edition
ISBN:9781337111348
Author:Bruce Crauder, Benny Evans, Alan Noell
Publisher:Bruce Crauder, Benny Evans, Alan Noell
Chapter5: A Survey Of Other Common Functions
Section5.3: Modeling Data With Power Functions
Problem 6E: Urban Travel Times Population of cities and driving times are related, as shown in the accompanying...

Related questions
Question
Transcribed Image Text:Section E: The IQ scores of a sample of 15 boys randomly selected from the population of fifteen year-old boys in
Victoria were recorded, and the sample mean and sample standard deviation from this sample were 106 and 4,
respectively. The IQ scores of a sample of 12 girls randomly selected from the population of fifteen year-old girls in
Victoria were recorded, and the sample mean and sample standard deviation from this sample were 114 and 5,
respectively. Let μ₁ denote the mean IQ score for fifteen year-old boys in Victoria and let µ₂ denote the mean IQ score
for fifteen year-old girls in Victoria. Researchers want to test, at the 5% level of significance, the null hypothesis
-
Ho: M1
- µ2 = −1 vs the alternative hypothesis Ha : µ₁ − µ₂ −1. Assume the population standard deviations of
the two groups are equal and that the assumptions of a two-independent sample t-test are satisfied. Answer the
following questions.
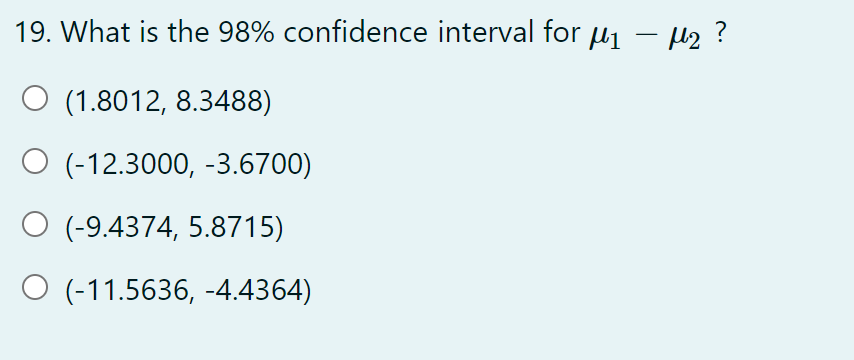
Transcribed Image Text:19. What is the 98% confidence interval for μ₁ − μ₂ ?
-
O (1.8012, 8.3488)
O (-12.3000, -3.6700)
(-9.4374, 5.8715)
O (-11.5636, -4.4364)
Expert Solution
This question has been solved!
Explore an expertly crafted, step-by-step solution for a thorough understanding of key concepts.

Step by step
Solved in 2 steps with 2 images

Recommended textbooks for you
Functions and Change: A Modeling Approach to Coll…
Algebra
ISBN:
9781337111348
Author:
Bruce Crauder, Benny Evans, Alan Noell
Publisher:
Cengage Learning
Functions and Change: A Modeling Approach to Coll…
Algebra
ISBN:
9781337111348
Author:
Bruce Crauder, Benny Evans, Alan Noell
Publisher:
Cengage Learning