Using the SPSS output above, what is the value of the coefficient of determination? 0.715 0.846 0.347 2.82
Using the SPSS output above, what is the value of the coefficient of determination? 0.715 0.846 0.347 2.82

Algebra & Trigonometry with Analytic Geometry
13th Edition
ISBN:9781133382119
Author:Swokowski
Publisher:Swokowski
Chapter3: Functions And Graphs
Section3.5: Graphs Of Functions
Problem 44E

Related questions
Question
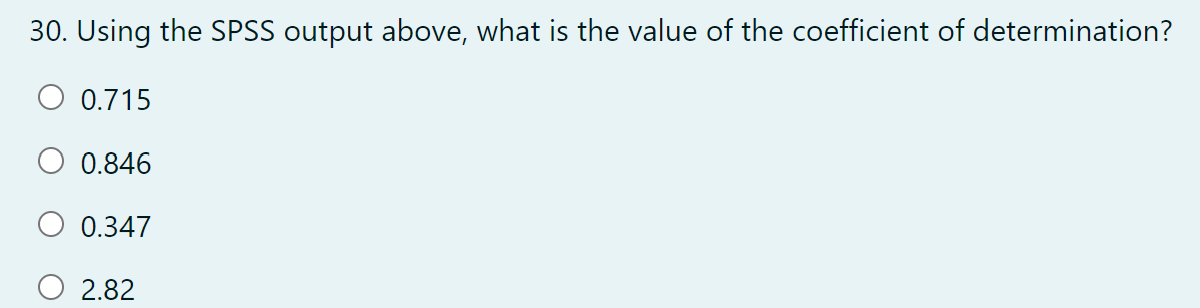
Transcribed Image Text:30. Using the SPSS output above, what is the value of the coefficient of determination?
0.715
0.846
0.347
O 2.82
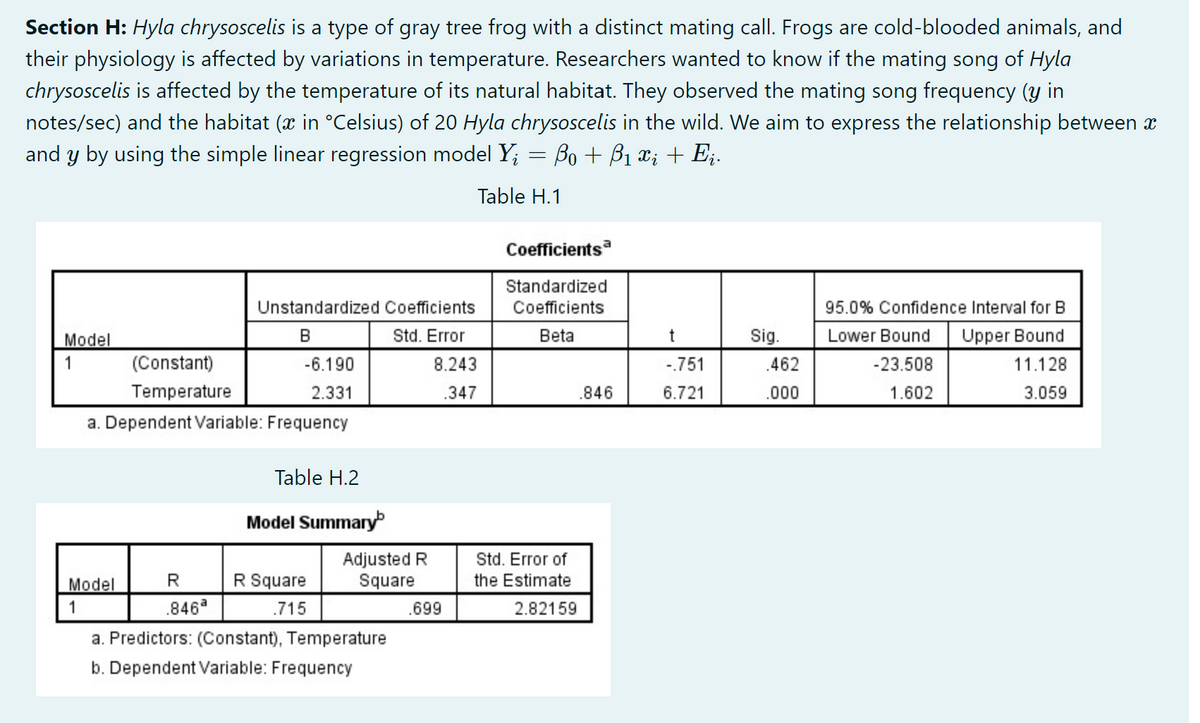
Transcribed Image Text:Section H: Hyla chrysoscelis is a type of gray tree frog with a distinct mating call. Frogs are cold-blooded animals, and
their physiology is affected by variations in temperature. Researchers wanted to know if the mating song of Hyla
chrysoscelis is affected by the temperature of its natural habitat. They observed the mating song frequency (y in
notes/sec) and the habitat (x in °Celsius) of 20 Hyla chrysoscelis in the wild. We aim to express the relationship between
and y by using the simple linear regression model Yį = ßo + ß₁ x; + Eį.
Table H.1
Coefficients
Standardized
Unstandardized Coefficients
Coefficients
95.0% Confidence Interval for B
Lower Bound
B
Std. Error
Beta
Sig.
Upper Bound
Model
1
(Constant)
-6.190
-23.508
11.128
Temperature
2.331
1.602
3.059
a. Dependent Variable: Frequency
Table H.2
Model Summary
Model
R Square
R
.846ª
1
.715
a. Predictors: (Constant), Temperature
b. Dependent Variable: Frequency
Adjusted R
Square
8.243
.347
.699
Std. Error of
the Estimate
2.82159
.846
t
-.751
6.721
.462
.000
Expert Solution
This question has been solved!
Explore an expertly crafted, step-by-step solution for a thorough understanding of key concepts.

Step by step
Solved in 2 steps

Recommended textbooks for you
Algebra & Trigonometry with Analytic Geometry
Algebra
ISBN:
9781133382119
Author:
Swokowski
Publisher:
Cengage
Algebra & Trigonometry with Analytic Geometry
Algebra
ISBN:
9781133382119
Author:
Swokowski
Publisher:
Cengage