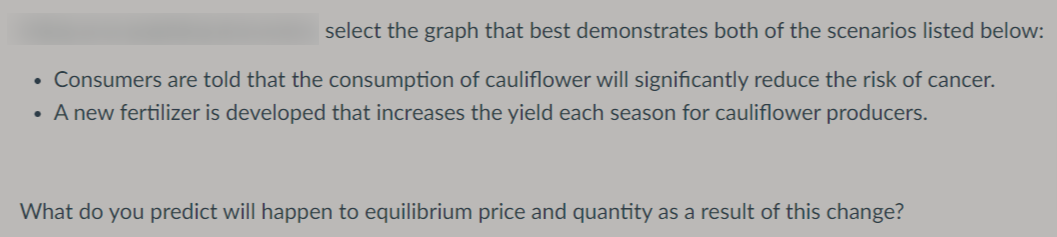
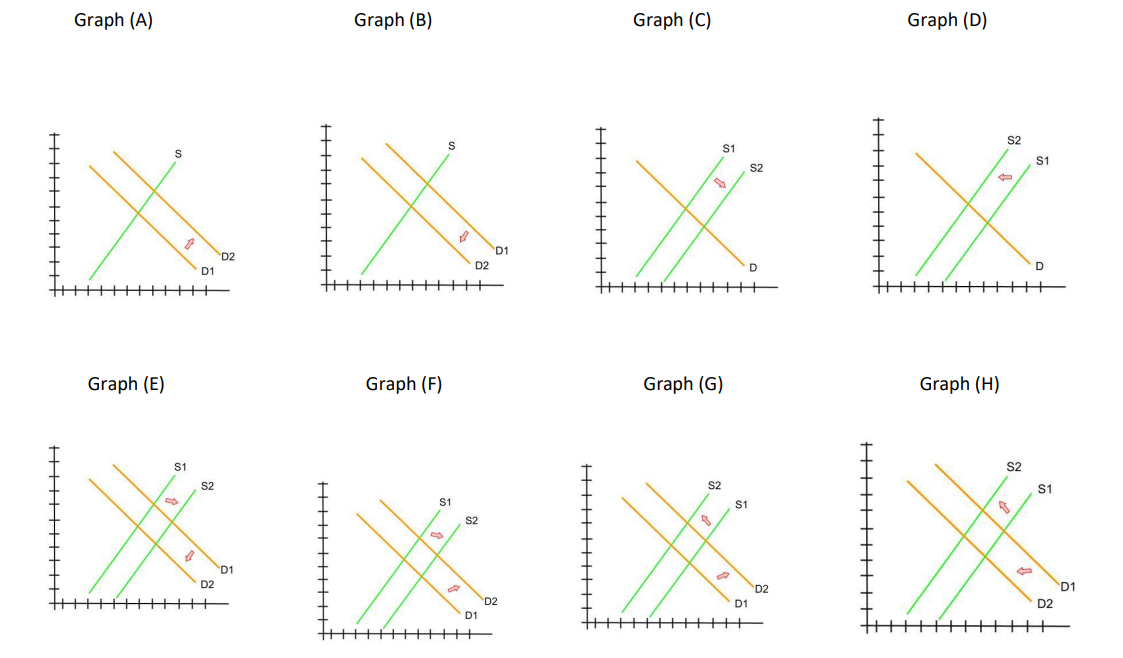
select the graph that best demonstrates both of the scenarios listed below: • Consumers are told that the consumption of cauliflower will significantly reduce the risk of cancer. • A new fertilizer is developed that increases the yield each season for cauliflower producers. What do you predict will happen to equilibrium price and quantity as a result of this change?
select the graph that best demonstrates both of the scenarios listed below: • Consumers are told that the consumption of cauliflower will significantly reduce the risk of cancer. • A new fertilizer is developed that increases the yield each season for cauliflower producers. What do you predict will happen to equilibrium price and quantity as a result of this change?

Chapter3: Supply And Demand: Theory
Section: Chapter Questions
Problem 1WNG

Related questions
Question
100%
Easy econ question, I will rate and like. Thank you!
Transcribed Image Text:select the graph that best demonstrates both of the scenarios listed below:
• Consumers are told that the consumption of cauliflower will significantly reduce the risk of cancer.
• A new fertilizer is developed that increases the yield each season for cauliflower producers.
What do you predict will happen to equilibrium price and quantity as a result of this change?
Transcribed Image Text:Graph (A)
Graph (B)
Graph (E)
S2
S
S1
S
S2
X X X X
D2
D2
D
D1
| │││
||||||
Graph (F)
Graph (C)
D1
|||||
Graph (D)
Graph (G)
Graph (H)
D
* * * *
+++
D1
Expert Solution
This question has been solved!
Explore an expertly crafted, step-by-step solution for a thorough understanding of key concepts.

Step by step
Solved in 2 steps

Knowledge Booster


Learn more about
Need a deep-dive on the concept behind this application? Look no further. Learn more about this topic, economics and related others by exploring similar questions and additional content below.Recommended textbooks for you

Economics (MindTap Course List)
Economics
ISBN:
9781337617383
Author:
Roger A. Arnold
Publisher:
Cengage Learning

Economics (MindTap Course List)
Economics
ISBN:
9781337617383
Author:
Roger A. Arnold
Publisher:
Cengage Learning

Managerial Economics: A Problem Solving Approach
Economics
ISBN:
9781337106665
Author:
Luke M. Froeb, Brian T. McCann, Michael R. Ward, Mike Shor
Publisher:
Cengage Learning

