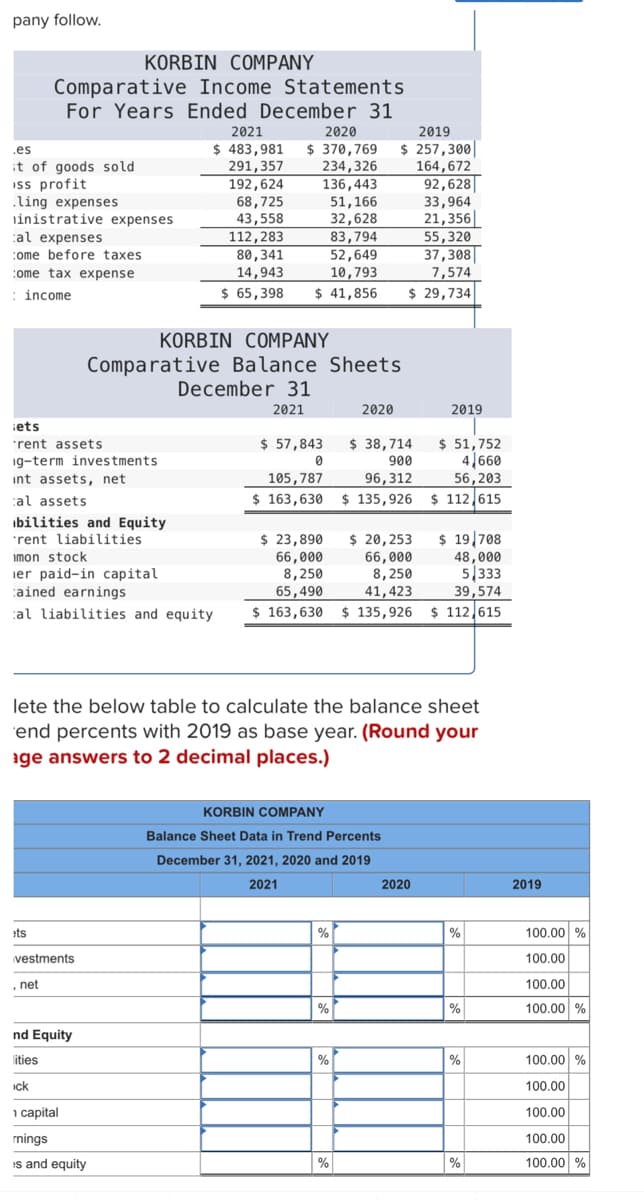
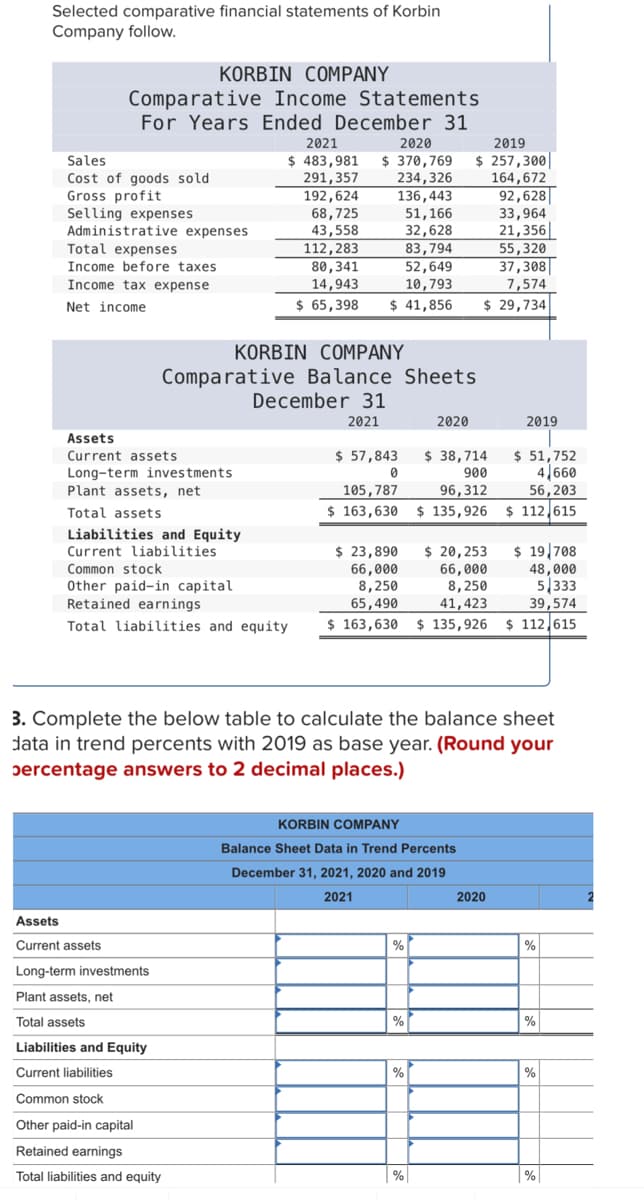
Selected comparative financial statements of Korbin Company follow. Comparative Income Statements For Years Ended December 31 Sales Cost of goods sold Gross profit Selling expenses Administrative expenses Total expenses Income before taxes Income tax expense Net income KORBIN COMPANY Assets Current assets Long-term investments Plant assets, net Total assets KORBIN COMPANY Comparative Balance Sheets Liabilities and Equity Current liabilities Common stock Other paid-in capital Retained earnings Assets Current assets Long-term investments Plant assets, net Total assets 2021 2020 2019 $ 483,981 $ 370,769 $ 257,300 291,357 234,326 164,672 92,628 33,964 21,356 55,320 37,308 7,574 $ 29,734 192,624 136,443 68,725 51,166 43,558 32,628 112,283 83,794 80,341 52,649 14,943 10,793 $ 65,398 $ 41,856 Liabilities and Equity Current liabilities Common stock Other paid-in capital Retained earnings Total liabilities and equity December 31 2021 $ 57,843 0 $ 23,890 $ 20,253 $ 19,708 66,000 66,000 48,000 8,250 8,250 41,423 5,333 39,574 65,490 Total liabilities and equity $ 163,630 $ 135,926 $ 112,615 $ 38,714 $ 51,752 900 4,660 105,787 96,312 56,203 $ 163,630 $ 135,926 $ 112,615 3. Complete the below table to calculate the balance sheet data in trend percents with 2019 as base year. (Round your percentage answers to 2 decimal places.) 2020 KORBIN COMPANY Balance Sheet Data in Trend Percents December 31, 2021, 2020 and 2019 2021 % % % 2019 % 2020 % % % %


Reporting Cash Flows
Reporting of cash flows means a statement of cash flow which is a financial statement. A cash flow statement is prepared by gathering all the data regarding inflows and outflows of a company. The cash flow statement includes cash inflows and outflows from various activities such as operating, financing, and investment. Reporting this statement is important because it is the main financial statement of the company.
Balance Sheet
A balance sheet is an integral part of the set of financial statements of an organization that reports the assets, liabilities, equity (shareholding) capital, other short and long-term debts, along with other related items. A balance sheet is one of the most critical measures of the financial performance and position of the company, and as the name suggests, the statement must balance the assets against the liabilities and equity. The assets are what the company owns, and the liabilities represent what the company owes. Equity represents the amount invested in the business, either by the promoters of the company or by external shareholders. The total assets must match total liabilities plus equity.
Financial Statements
Financial statements are written records of an organization which provide a true and real picture of business activities. It shows the financial position and the operating performance of the company. It is prepared at the end of every financial cycle. It includes three main components that are balance sheet, income statement and cash flow statement.
Owner's Capital
Before we begin to understand what Owner’s capital is and what Equity financing is to an organization, it is important to understand some basic accounting terminologies. A double-entry bookkeeping system Normal account balances are those which are expected to have either a debit balance or a credit balance, depending on the nature of the account. An asset account will have a debit balance as normal balance because an asset is a debit account. Similarly, a liability account will have the normal balance as a credit balance because it is amount owed, representing a credit account. Equity is also said to have a credit balance as its normal balance. However, sometimes the normal balances may be reversed, often due to incorrect journal or posting entries or other accounting/ clerical errors.


Trending now
This is a popular solution!

Step by step
Solved in 2 steps with 2 images


