Show: Step 1: State the hypothesis Step 2: The level of significance, degree of freedom and critical region Step 3: Compute for the value Step 4: Decision rule Step 5: Conclusion 1. A survey of the National Capital Region finds the average commute time of employees on one way is 45 minutes. The Makati Chamber of Commerce feels that in their city it is greater and want to publicize this. They randomly selected 28
Show: Step 1: State the hypothesis Step 2: The level of significance, degree of freedom and critical region Step 3: Compute for the value Step 4: Decision rule Step 5: Conclusion 1. A survey of the National Capital Region finds the average commute time of employees on one way is 45 minutes. The Makati Chamber of Commerce feels that in their city it is greater and want to publicize this. They randomly selected 28

MATLAB: An Introduction with Applications
6th Edition
ISBN:9781119256830
Author:Amos Gilat
Publisher:Amos Gilat
Chapter1: Starting With Matlab
Section: Chapter Questions
Problem 1P

Related questions
Question
Problem#1
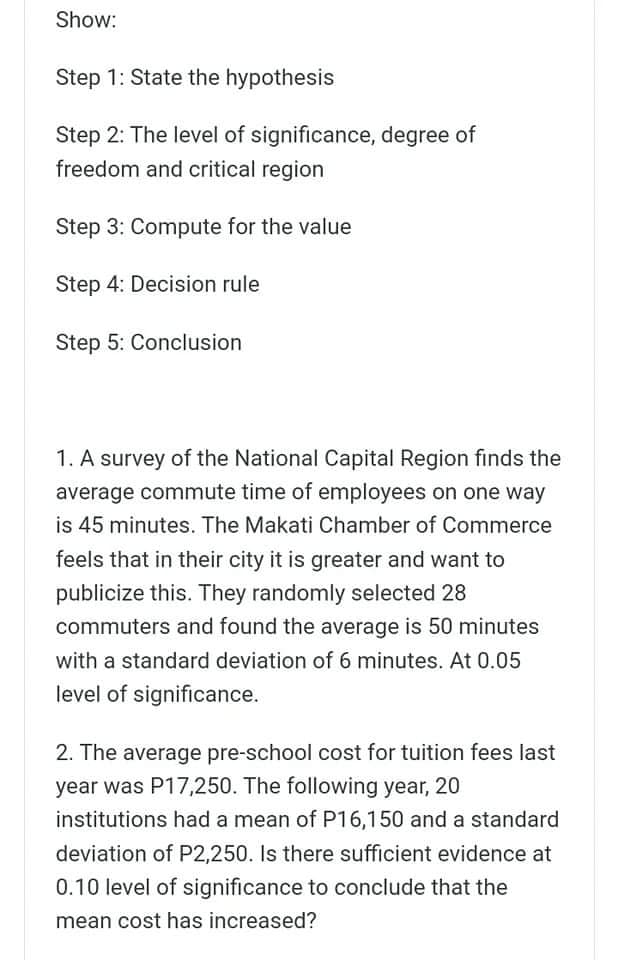
Transcribed Image Text:Show:
Step 1: State the hypothesis
Step 2: The level of significance, degree of
freedom and critical region
Step 3: Compute for the value
Step 4: Decision rule
Step 5: Conclusion
1. A survey of the National Capital Region finds the
average commute time of employees on one way
is 45 minutes. The Makati Chamber of Commerce
feels that in their city it is greater and want to
publicize this. They randomly selected 28
commuters and found the average is 50 minutes
with a standard deviation of 6 minutes. At 0.05
level of significance.
2. The average pre-school cost for tuition fees last
year was P17,250. The following year, 20
institutions had a mean of P16,150 and a standard
deviation of P2,250. Is there sufficient evidence at
0.10 level of significance to conclude that the
mean cost has increased?
Expert Solution
This question has been solved!
Explore an expertly crafted, step-by-step solution for a thorough understanding of key concepts.

Step by step
Solved in 2 steps with 1 images

Recommended textbooks for you
MATLAB: An Introduction with Applications
Statistics
ISBN:
9781119256830
Author:
Amos Gilat
Publisher:
John Wiley & Sons Inc

Probability and Statistics for Engineering and th…
Statistics
ISBN:
9781305251809
Author:
Jay L. Devore
Publisher:
Cengage Learning

Statistics for The Behavioral Sciences (MindTap C…
Statistics
ISBN:
9781305504912
Author:
Frederick J Gravetter, Larry B. Wallnau
Publisher:
Cengage Learning
MATLAB: An Introduction with Applications
Statistics
ISBN:
9781119256830
Author:
Amos Gilat
Publisher:
John Wiley & Sons Inc
Probability and Statistics for Engineering and th…
Statistics
ISBN:
9781305251809
Author:
Jay L. Devore
Publisher:
Cengage Learning
Statistics for The Behavioral Sciences (MindTap C…
Statistics
ISBN:
9781305504912
Author:
Frederick J Gravetter, Larry B. Wallnau
Publisher:
Cengage Learning

Elementary Statistics: Picturing the World (7th E…
Statistics
ISBN:
9780134683416
Author:
Ron Larson, Betsy Farber
Publisher:
PEARSON

The Basic Practice of Statistics
Statistics
ISBN:
9781319042578
Author:
David S. Moore, William I. Notz, Michael A. Fligner
Publisher:
W. H. Freeman

Introduction to the Practice of Statistics
Statistics
ISBN:
9781319013387
Author:
David S. Moore, George P. McCabe, Bruce A. Craig
Publisher:
W. H. Freeman