Show that in Example 4.4.7, page 153, the difference between the two candidates is statistically significant even at a confidence level of 99.7%.
Show that in Example 4.4.7, page 153, the difference between the two candidates is statistically significant even at a confidence level of 99.7%.

Holt Mcdougal Larson Pre-algebra: Student Edition 2012
1st Edition
ISBN:9780547587776
Author:HOLT MCDOUGAL
Publisher:HOLT MCDOUGAL
Chapter11: Data Analysis And Probability
Section: Chapter Questions
Problem 8CR

Related questions
Topic Video
Question
Show that in Example 4.4.7, page 153, the difference between the two candidates is statistically significant even at a confidence level of 99.7%.
Transcribed Image Text:Now to the numbers! Let's begin with Candidate A. We have the following
numbers: sample size n =
1350, favorable voters k
648. Therefore p
648
0.48 or 48%, and o 2
1350 x 0.48 х (1 — 0.48) ~ 18.3565, so the
1350
18.3565
standard error is st.err. -
a 0.0136 or 1.36%.
1350
CHAPTER 4. STATISTICS
153
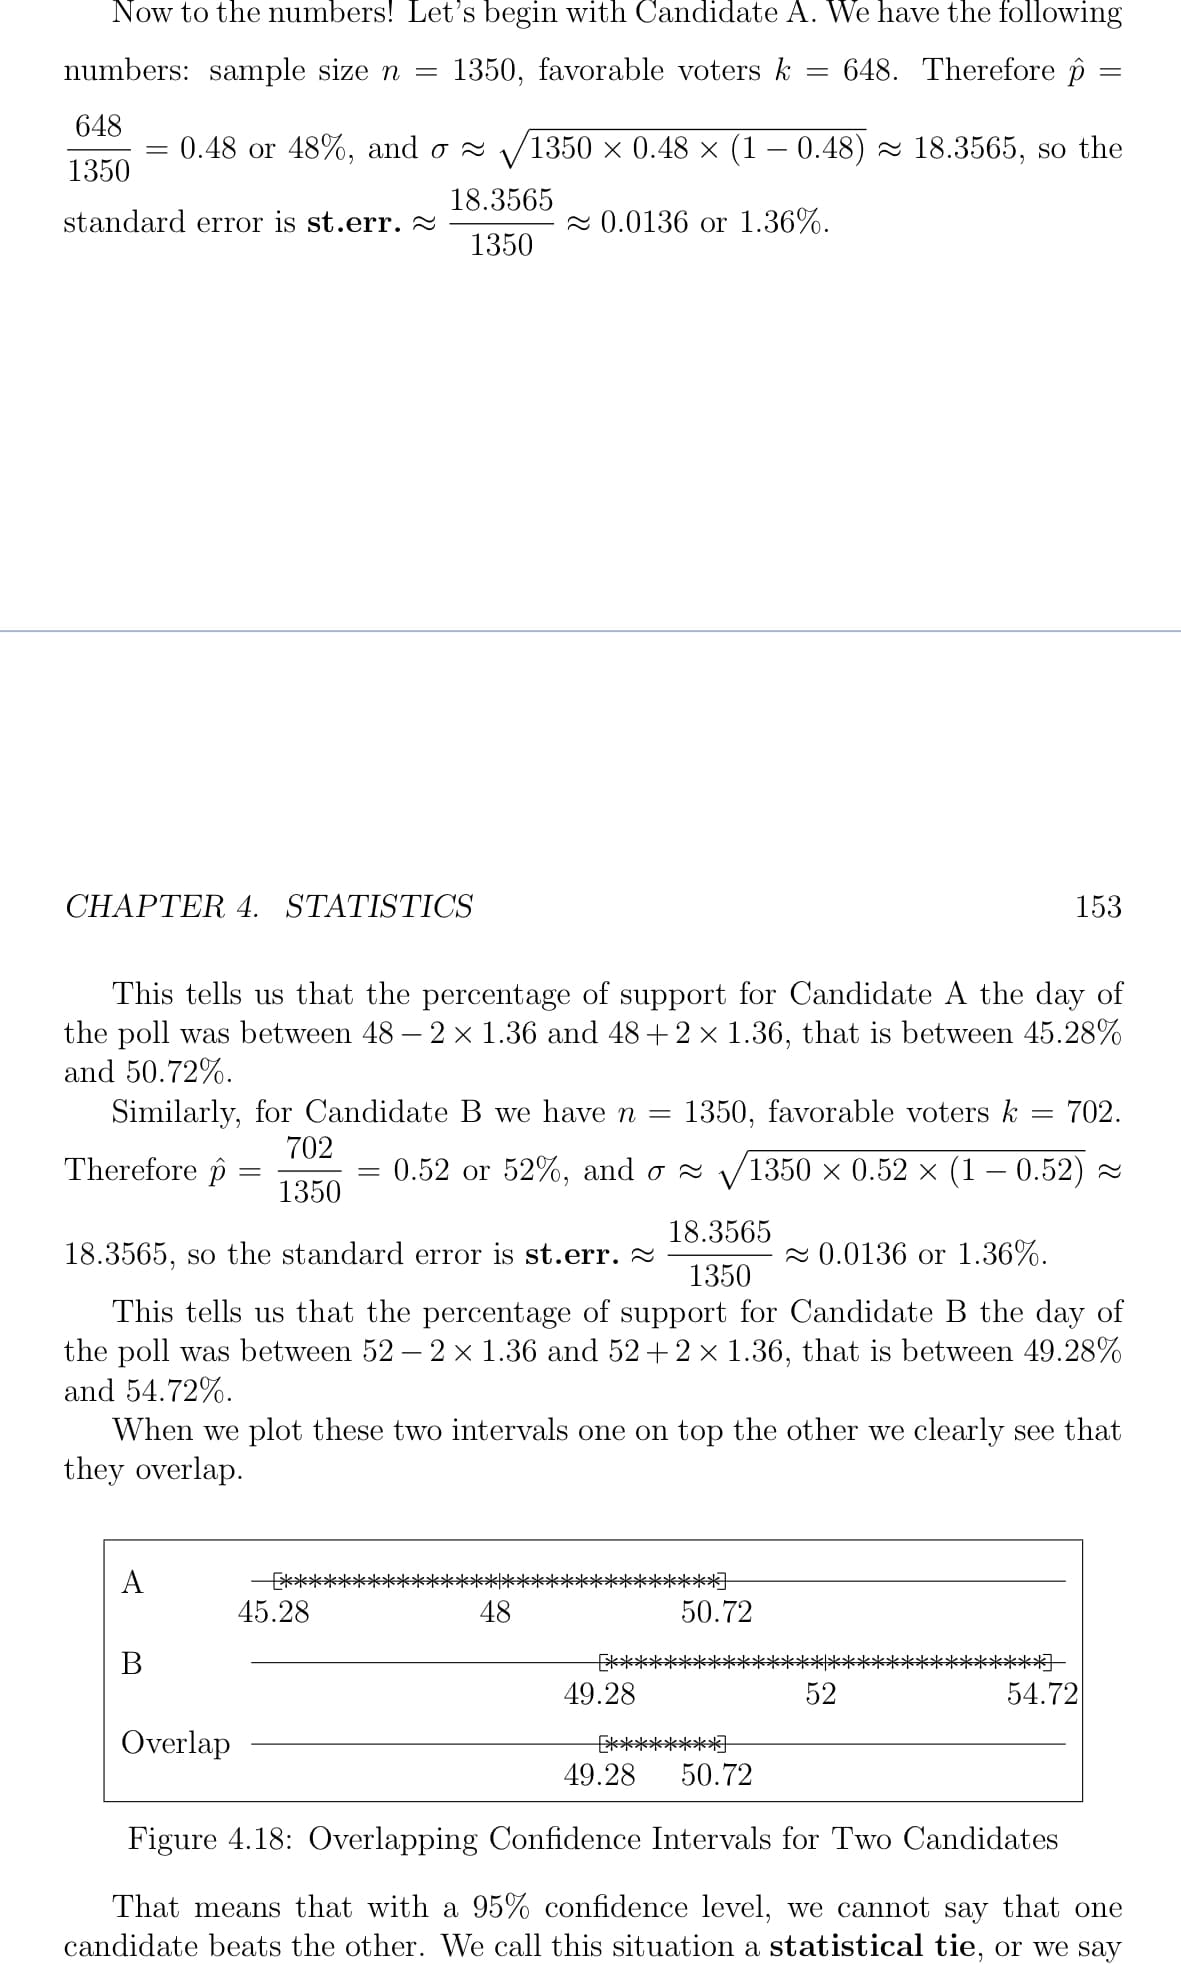
This tells us that the percentage of support for Candidate A the day of
the poll was between 48 – 2 × 1.36 and 48+2×1.36, that is between 45.28%
and 50.72%.
Similarly, for Candidate B we have n =
1350, favorable voters k
702.
702
Therefore p =
— 0.52 or 52%, and o ~ y/1350 x 0.52 х (1 — 0.52) ~
1350
18.3565
18.3565, so the standard error is st.err. 2
2 0.0136 or 1.36%.
1350
This tells us that the percentage of support for Candidate B the day of
the poll was between 52 – 2 × 1.36 and 52+ 2×1.36, that is between 49.28%
and 54.72%.
When we plot these two intervals one on top the other we clearly see that
they overlap.
A
E**
*****I
45.28
48
50.72
В
E******:
******I
49.28
52
54.72
Overlap
E********I
49.28
50.72
Figure 4.18: Overlapping Confidence Intervals for Two Candidates
That means that with a 95% confidence level, we cannot say that one
candidate beats the other. We call this situation a statistical tie, or we say
Expert Solution
This question has been solved!
Explore an expertly crafted, step-by-step solution for a thorough understanding of key concepts.

This is a popular solution!

Trending now
This is a popular solution!

Step by step
Solved in 2 steps with 5 images

Knowledge Booster


Learn more about
Need a deep-dive on the concept behind this application? Look no further. Learn more about this topic, statistics and related others by exploring similar questions and additional content below.Recommended textbooks for you
Holt Mcdougal Larson Pre-algebra: Student Edition…
Algebra
ISBN:
9780547587776
Author:
HOLT MCDOUGAL
Publisher:
HOLT MCDOUGAL

Holt Mcdougal Larson Pre-algebra: Student Edition…
Algebra
ISBN:
9780547587776
Author:
HOLT MCDOUGAL
Publisher:
HOLT MCDOUGAL