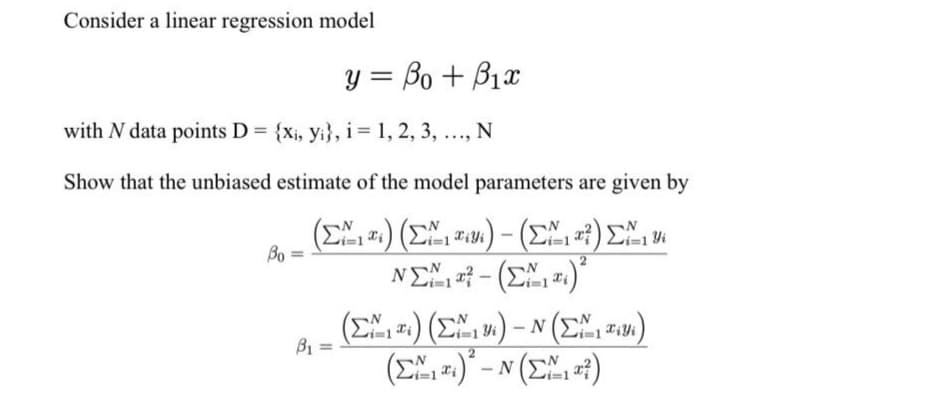
Show that the unbiased estimate of the model parameters are given by


Q: Compute the least-squares regression line for predicting the 2012 budget from the 2006 budget. Round…
A: We have given that, 2006 (X) :- 5, 2, 124, 142, 247 2012 (Y) :- 6, 2, 146, 146, 232 Then, We will…
Q: Above, a table was created to calculate the coefficients of the linear regression y=ax+b model for a…
A:
Q: Give two examples of parameters and explain each in terms of point estimates and point estimators.
A: Given that Give two examples of parameters and explain each in terms of point estimates and point…
Q: Explain the Parameter reduction by using the ADL model?
A: Autoregressive Distributed Model Lag (ADL) -The regressors of one or more explanatory variables may…
Q: What is the least-squares line approximation to a set of datapoints? How is the line determined?
A: The least squares is defined for the formula that can be used to measure the accuracy of the…
Q: .., Based on the coefficient of determination (r) for each linear regression models developed, which…
A: Pearson's correlation coefficient for the response variable Y and predictor variable X is given by,…
Q: Solve the mean and variance value of the model using the moment definition.
A: The following probability function is given as: f(x)=3 ; 0<x<10 ; Otherwise
Q: The number of adults (in millions) using e-book devices is expected to climb in the years ahead. The…
A:
Q: What is the estimated value for our parameter µa?
A: The 95 % confidence interval for our parameter is given by (1.09, 9.76)
Q: The short-run average total cost (ATC) curve of a firm will tend to be U-shaped because larger fırms…
A: The shape of ATC curve is U-shaped when there are diminishing return with increasing average costs…
Q: How can we make predictions using a fitted model in R?
A: Note: Hey there! Thank you for the question. As this is a generalized question, we have explained…
Q: Compute the least-squares regression equation for the given data set. Round the slope and…
A:
Q: Locate the critical point and determine the maximum or minimum points: a²y = x*
A: Using 2nd derivative test,
Q: What are the assumptions and conditions for using the t-model?
A: When we do not know the population standard deviation and also if the sample size is less than 30…
Q: If we have a dummy variable with 15 levels, we need to add 15 variables into a linear/ logistic…
A: False, if we have dummy variables with k levels, we use k+1 variables in the linear/logistic…
Q: It is known that a natural law obeys the quadratic relationship y = ax-. What is the best line of…
A:
Q: Use a smoothing constant ALPHA = 0.8 and calculate the forecasted value and smoothing value
A: The data set of the Shiller Real Home Price Index for the years 1934-1944 is given below. Year…
Q: in general, how violations of each of the linear regression model assumptions will affect the…
A: It is an important part of statistics . It is widely used .
Q: Define Dynamic effects and the distributed lag model?
A:
Q: It is required to use the data given in the table to estimate the parameters of the simple linear…
A: The given data is x y 0 6 1 2 2 3 3 1 4 0 We use the method of least squares to…
Q: doesn't this mean there are no critical points
A: Given the function fx,y=10x2-5y2
Q: On the second sheet is data which shows the rate of growth of a particular patch of bamboo vs daily…
A: a. Procedure for obtaining Scatter plot in excel : Step 1: Select the data. Step 2: Select the…
Q: V26.9
A:
Q: Discuss the importance of a model being well documented.
A: Spreadsheet models are an important tool for many different areas and calculations like budget, risk…
Q: Consider a linear spline with 19 knots. How many regression coefficients do you estimate when…
A: Answer: Only two regression coefficients will be estimated from the regression model. In any…
Q: Explain Generalized Method of Moments Estimation in Linear Models?
A:
Q: propose a model that fulfill all five assumptions of the disturbance terms in classical linear…
A:
Q: 11. Consider a competitive market where the demand and the supply depend on the current price of the…
A:
Q: Determine the equation of the least-squares approximating line that is the best fit for the data…
A: To determine the equation of the least squares approximation line that is the best fit for the data…
Q: Which of the following residual plots suggests that a linear model may not be applicable to the data…
A: The residuals (e) are calculated by taking difference between observed value and predicted value…
Q: Explain the term "Autoregressions"? Define The First-Order Autoregressive Model?
A: Here {Xt} is regressed on past values of Xt, hence the prefix "auto". Autoregressive models of order…
Q: Discuss the basic differences between the maximum a posteriori and maximum- likelihood estimates of…
A: What is the contrast between Maximum Likelihood (ML) and Maximum a Posteriori (MAP) assessment?As…
Q: Define equation used for least squares regression of a line?
A:
Q: Consider a linear spline with 16 knots. How many regression coefficients do you estimate when…
A: Given information: The regression model is a linear spline with 16 knots.
Q: Determine the local minima, local maxima, and saddle points of
A: Given, fx,y=x2-4xy+2y4+1 First find fx,fxx,fy,fyy and fxy. fx=∂f∂x=2x-4y fy=∂f∂y=8y3-4x fxx=∂fx∂x=2…
Q: Find the orthogonla trajectories of the family of the curve r = csine
A: Family of curves: r = csinθ
Q: determine which set come from the least squares regression model a
A: if we estimate the parameter from the given observation that is response =yi={5,3,2,4} and…
Q: It is known that a natural law obeys the quadratic relationship y = ax“. What is the best line of…
A: Step:1 Question : It is realized that a characteristic law submits to the quadratic relationship y…
Q: Moreover, Dr. Castillejo suspects that other than maximum pulse rate (from 152bpm to 196 bpm), other…
A: Regression are used to determine the linear relationship between two variable, they are independent…
Q: Derive the standard error of the point estimator Bo-
A:
Q: The following is the result of the multiple linear regression analysis in STATISTICA, where the…
A: According to the regression table, the intercept is significant. Hence, we will use intercept-model…
Q: Assuming the model is re-estimated with additional new variable (lagged of LGDP), based on the new…
A: Here we find that the conclusion about the autocorrelation diagnostic test.The estimated regression…
Q: Suppose now the simple linear regression model only has the intercept term (ßo): Yi = Bo + Ei, for i…
A: The simple linear regression model is given as : yi=βo+εi, i=1,2..n By applying least squares, the…
Q: 7. Moreover, Dr. Castillejo suspects that other than maximum pulse rate (from 152bpm to 196 bpm),…
A: Regression are used to determine the linear relationship between two variable, they are independent…
Q: Is Assumption MLR1. Linear in Parameters satisfied for the following model? Explain.
A: A model is said to be linear in parameters if partial derivatives of y with respect to each of…
Q: What is the TSS of the model?
A:
Q: Explain the Regression Functions That Are Nonlinear in the Parameters?
A: Regression functions. The regression functions support the fitting of an ordinary-least-squares…
Q: If the data is highly skewed, can we still rely on the kurtosis coefficient? Why or why not?
A: Introduction - Skewness - Skewness refers to a distortion or asymmetry that deviates from the…

Step by step
Solved in 3 steps with 3 images

- propose a model that fulfill all five assumptions of the disturbance terms in classical linear regressionThe coefficients in a distributed lag regression of Y on X and its lags can be interpreted as the dynamic causal effects when the time path of X is determined randomly and independently of other factors that influence Y. Explain How?The least-squares regression equation is y=620.6x+16,624 where y is the median income and x is the percentage of 25 years and older with at least a bachelor's degree in the region. The scatter diagram indicates a linear relation between the two variables with a correlation coefficient of 0.7004. Predict the median income of a region in which 30% of adults 25 years and older have at least a bachelor's degree.
- Use the general equation for the least square regression line to show that this line always passes through the point (x,y) * bars above the x and y.That is, set x=x(with a bar above the x) and show that the line predicts that y=y (with a bar above the y).The least-squares regression equation is y=728.0x+14,705 where y is the median income and x is the percentage of 25 years and older with at least a bachelor's degree in the region. The scatter diagram indicates a linear relation between the two variables with a correlation coefficient of 0.8165. For every dollar increase in median income, the percent of adults having at least a bachelor's degree is ___%, on average. For a median income of $0, the percent of adults with a bachelor's degree is ____%.Suppose we want to predict job performance of mechanics based on mechanical aptitude test scores and test scores from personality test that measures conscientiousness. (a) Determine the regression equation. (b) Determine the SSE. Y X1 X2 1 40 25 2 45 20 1 38 30 3 50 30 2 48 28 3 55 30 3 53 34 4 55 36 4 58 32 3 40 34 5 55 38 3 48 28 3 45 30 2 55 36 4 60 34 5 60 38 5 60 42 5 65 38 4 50 34 3 58 38 Where Y is the Performance of the mechanics, X1 is the mechanical aptitude test and X2 is the personality test score that measure conscientiousness.
- Find the least-squares regression line y^ =b0+b1x through the points (−2,0),(2,6),(5,14),(8,20),(10,26) and then use it to find point estimates y^ corresponding to x=1 and x=8. For x=1, y^ =? For x=8, y^ =?Find the least linear regression of (1, 0), (3, 3), and (5, 6)The annual energy consumption in billions of Btu for both natural gas and coal is shown for a random selection of states. Gas 223 474 377 289 747 146 Coal 478 631 413 356 736 474 If 500 billion Btu of natural gas is used then what is the projected amount of coal that is usedThe projected amount of coal that is used is billion Btu. (Use your regression equation with the rounded values for m and b to find your answer to this question. Round your answer to THREE decimal places, add extra zeros at the end, if needed) (Round answer to 3 decimal places, for example, XXX.XXX)
- How can we make predictions using a fitted model in R?Consider the fitted values from a simple linear regression model with intercept: yˆ = 5 + 6x. Assume that the total number of observations is n = 302. In addition, the R-squared of the regression is R2 = 0.6 and Pn i=1(xi − x¯) 2 = 15, where ¯x is the sample mean of x. Under the classical Gauss-Markov assumptions standard error of the estimated slope coefficient = 0.0365 value of the t-statistic for the null hypothesis H0 : the slope coefficient is equal to 0 versus H1 : the slope coefficient is different from 0 = 164.3836 What is the value of the F-statistic for the null hypothesis H0 : the slope coefficient is equal to 0 versus H1 : the slope coefficient is different from 0? Do the p-values of the t- and F-tests differ from each other? Justify your answer.justify the reasons for the in1.Econometrics deals with the measurement of economic relationships which are stochastic or random. The simplest form of economic relationships between two variables X and Y can be represented by: ; where are regression parameters and the stochastic disturbance term Justify the reasons for the insertion of U-term in the modelsertion of of u (error term) in the model Y=a+bX+u?