Show the productivity percentage change for each category and then determine the improvement for labor-hours, the typical standard for comparison.


Q: Mariah Enterprises makes a variety of consumer electronic products. Its camera manufacturing plant…
A: Given that - The value of process output for Alpha = $150 per unit of product A and the value of…
Q: In December, RMO Manufacturing had Actual Output of 100 units. Its Effective Capacity dropped to 120…
A: Given Data: Actual Output=100units Effective Capacity= 120units Design capacity = 200 units
Q: A seed company has a design capacity of 80 metric tonnes per day. It's effective capacity, However,…
A: Design capacity is 80 metric tonnes per day, effective capacity is 64 metric tonnes per day, and…
Q: grade-point averages (GPAS) after students were in the Sante Fe each student scored on the high…
A: Given: Quarter sales (X) Contracts released(Y) 1 8 153 2 10 172 3 15 197…
Q: Zychol Chemicals Corporation Bob Richards, the production manager of Zychol Chemicals, in Houston,…
A: Productivity analysis is directed to recognize areas for possible productivity enhancement plans.…
Q: Katrina Design has decided to experiment with two alternative manufacturing approaches, identified…
A: 1. The partial operational productivity ratios for each of the production approaches are as follows,…
Q: Mark Tuan, the Production Manager at MT Mills, can currently expect his operation to produce 1000…
A: Find the given details below: Given Details: Current Production Output 1000 Square yards/ ton…
Q: JJ Boutique has opened four new stores in college towns across the state. Data on monthly sales…
A: Multifactor productivity is the outputs produced per input used. It considers all the inputs that…
Q: The following table shows data on the average number of customers processed by several bank service…
A: Given data The following formula will calculate labor productivity
Q: An air-conditioner factory makes three different types of air-conditioners: the ceiling type, the…
A: a) Total revenue = sum of (units x price) Total revenue = {(2*350)+ (4*450) + (6*500)} = euro 5500…
Q: Christopher's Cranks uses a machine that can produce 100 cranks per hour. The firm operates 12 hours…
A: Ideally: Production per hour = 100 crank Production per day = hours per day * production per hour…
Q: In their efforts to plan for production, the Operations Planning Group at the Akon Manufacturing…
A: Given that: Quarter Forecast 1 12800 2 12500 3 13100 4 12100
Q: Santura furniture makes study tables. The weekly dollar value of its output, including finished…
A:
Q: Mark's Ceramics spent $4000 on a new kiln last year in the belief that it would cut energy usage 25%…
A: Last Year This Year Production (finished units) 4000 4000 Greenware (pounds)…
Q: Munson Performance Auto Inc., modifies 350 autos per year. The manager, Adam Munson, is interested…
A: Total cost is the cost in which variable and fixed both the costs are involved.
Q: 4- George Kyparisis makes bowling balls in his Miami plant. With recent increases in his costs, he…
A:
Q: he percent change in productivity for one month last year versus one month this year on a…
A: productivity refers to an index that can be used by an organization to measure the outputs relative…
Q: A company BioProd Itd. manufactures components for a ventilator unit used in the medical field.…
A: Company Bioprod is currently making annual production ranging from 1400 to 1600 units of product.…
Q: Susan Williams runs a small Flagstaff job shopwhere garments are made. The job shop employs eight…
A: SOLUTION: NUMBER OF WORKERS 8 HOURLY WAGE $10 WORKING HOURS PER WEEK 45 PRODUCTION…
Q: A chair manufacturer who produces three different models ( A,B and C) has developed a master…
A: Given information Week No 1 2 3 4 5 A 200 0 200 0 100 B 0 0 0 200 100 C 100 300 100…
Q: Lucas Diving Supplies Company, in its first year of business, had labor costs of $66,000, overhead…
A: direct materials used + direct labor used + manufacturing overhead assigned = the manufacturing…
Q: 1. Determine the utilization and the efficiency for each of these situa a. A loan processing…
A: Calculations: Formula:
Q: Mazen is a manager in a factory producing fabrics. In 202O, the daily production target was met in…
A: Efficiency and effectiveness are the two terms that are necessary for the organization. Every…
Q: 1.6 Eric Johnson makes billiard balls in his New England plant. With recent increases in his costs,…
A: Productivity is the ability to manufacture the finished products more effectively and efficiently in…
Q: George Kyparisis makes bowling balls in his Miami plant. With recent increases in his costs, he has…
A: Last YearProduction level = 1,000 unitsLabour = 300 hours which is equivalent to $ 10 x 300 =…
Q: A property title search firm is contemplating using online software to increase its search…
A: Ans 1: Productivity refers to the ratio of input to the output. Productivity per dollar input for…
Q: Collins Little Company has a staff of 4, each working 8 hours per day (for a payroll cost of $ 640 /…
A: Given Information:- With old system: Number of staff = 4 Working hours per day =8 Payroll cost =…
Q: Mariah Enterprises makes a variety of consumer electronic products. Its camera manufacturing plant…
A:
Q: A property title search firm is contemplating using online software to increase its search…
A: Current Company- Average time=40 minutes Cost= Average time x researcher cost = 40 x $2 =$80…
Q: Firm A operates 8 hours each day, producing 80 parts/hour. If productivity were increased 20%, how…
A: Given, Firm A operates 8 hours a day. Productivity = 80 parts/hour Productivity is increased by 20%
Q: company has introduced a process improvement that reduces processing time for each unit; output is…
A: Given data is Output increased by less material(New) = 40% = 2520 Additional workers required = 2…
Q: George Kyparisis makes bowling balls in his Miami plant. With recent increases in his costs, he has…
A: Given: Units produced last year = U1 = 1000 Labor hours required last year = H1 = 300 Units produced…
Q: Suggest measurements of productivity which are often usedby operations managers in:a. Airline b. Bus…
A: measurement of Productivity can be defined as the ratio of output and input. The qualitative…
Q: 1. The manager of a crew that installs carpeting has tracked the crew's output over the past several…
A: Productivity is the comparison between the output and input of the production factors used in the…
Q: 1.5 George Kyparisis makes bowling balls in his Miami plant. With recent increases in his costs, he…
A: Multifactor productivity considers all the available resources and calculates productivity.…
Q: Christopher's Cranks uses a machine that can produce 100 cranks per hour. The firm operates 12 hours…
A: Production is the process consist of different stages. Each stage have different combinations of the…
Q: Rushing yardage for three Heisman Trophy candidates is given below. Which candidate is the most…
A:
Q: d effect of achieving operations excellence in mechanical world at the cost of anxiety, stress,and…
A: Operations excellence is the way of thinking in the work environment where critical thinking,…
Q: Describe three Operations Management decisions NOT mentioned in the case that must be taken at One…
A: Hello thank you for the question. As per guidelines, we would provide only one answer at a time.…
Q: 1.5 George Kyparisis makes bowvling balls in his Miami plant. With recent increases in his costs, he…
A: Multifactor productivity is the productivity of all the factors that contribute to producing output.…
Q: A company manufactures particle boards in a production facility. With recent increases in input…
A: Information given for last year and current year is as follows:
Q: George Kyparisis makes bowling balls in his Miami plant. With recent increases in his costs, he has…
A: Given- Labor cost = $10 per hourResin cost = $6 per poundCapital cost= 1% per monthEnergy cost =…
Q: George Kyparisis makes bowling balls in his Miami plant. With recent increases in his costs, he has…
A: Solution The productivity is given by - Productivity P= outputinput1. Labor ProductivityLast year,…
Q: What exactly is a balanced scorecard, and how does it relate to operations
A: A financial viewpoint is nothing other than a framework for translating an organization's strategic…
Q: The following data was recorded last period for production department that under the management of…
A: Capacity ratio defines to show the capacity. It's a comparison of the number of working days in the…
Q: Lucy and Marry have jobs wrapping chocolate candies and placing them into boxes. Lucy, a novice…
A: This question is related to the topic-Production Management and this topic falls under the…
Q: A parcel delivery company delivered 103,000 packages last year when its average employment was 84…
A: Productivity is calculated as, Number of packages = 103,000 number of drivers = 84
Q: Simple regression results from the data of Adriana Corporation are as follows: Equation: Overhead =…
A: Given Information: Regression equation: Overhead = 206469 + 45.83*Machine Hours
Problem No. 3
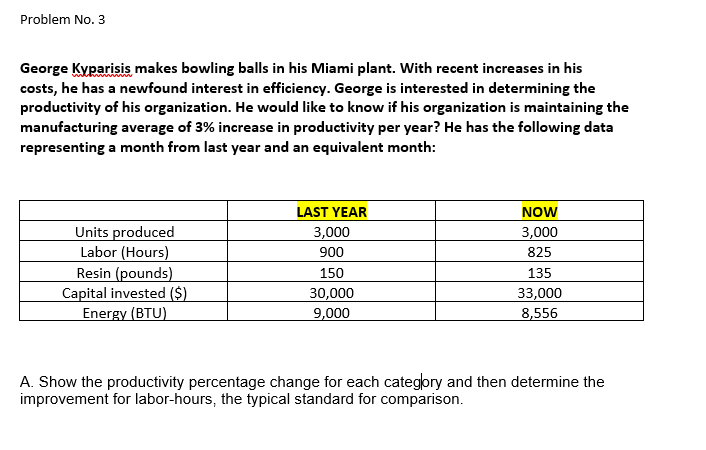
George Kyparisis makes bowling balls in his Miami plant. With recent increases in his costs, he has a newfound interest in efficiency. George is interested in determining the productivity of his organization. He would like to know if his organization is maintaining the manufacturing average of 3% increase in productivity per year? He has the following data representing a month from last year and an equivalent month:
| LAST YEAR | NOW | |
| Units produced | 3,000 | 3,000 |
| Labor (hours) | 900 | 825 |
| Resin (pounds) | 150 | 135 |
| Capital Invested ($) | 30,000 | 33,000 |
| Energy (BTU) | 9,000 | 8,556 |
- Show the productivity percentage change for each category and then determine the improvement for labor-hours, the typical standard for comparison.


Trending now
This is a popular solution!

Step by step
Solved in 2 steps with 5 images

- George Kyparisis makes bowling balls in his Miamiplant. With recent increases in his costs, he has a newfound interestin efficiency. George is interested in determining the productivityof his organization. He would like to know if his organization is maintaining the manufacturing average of 3% increase in produc-tivity per year? He has the following data representing a month from last year and an equivalent month this year:George Kyparisis makes bowling balls in his Miami plant. With recent increases in his costs, he has a newfound interest in efficiency. George is interested in determining the productivity of his organization. He would like to know if his organization is maintaining the manufacturing average of a 3% increase in productivity. He has the following data representing a month from last year and an equivalent month this year: Last Year Now Cost Per Input Unit Units Produced 1 comma 0001,000 1 comma 0001,000 Labor (hours) 300300 275275 $1010 per hour Resin (pounds) 5050 4545 $66 per pound Capital Invested ($) 10 comma 00010,000 11 comma 00011,000 22% per month Energy (BTU) 3 comma 0003,000 2 comma 8502,850 $0.600.60 per BTU The percent change in productivity for one month last year versus one month…George Kyparisis makes bowling balls in his Miami plant. With recent increases in his costs, he has a newfound interest in efficiency. George is interested in determining the productivity of his organization. He would like to know if his organization is maintaining the manufacturing average of a 3% increase in productivity. He has the following data representing a month from last year and an equivalent month this year: Last Year Now Cost Per Input Unit Units Produced 1,200 1,200 Labor (hours) 280 255 $10 per hour Resin (pounds) 50 45 $6 per pound Capital Invested ($) 10,000 11,000 2% per month Energy (BTU) 3,000 2,850 $0.50 per BTU The percent change in productivity for one month last year versus one month this year on a multifactor basis with dollars as the common denominator = nothing%…
- Susan Williams runs a small Flagstaff job shop where garments are made. The job shop employs eight workers. Each worker is paid $8 per hour. During the first week of March, each worker worked 45 hours. Together, they produced a batch of 156 garments. Of these garments, 54 were 'seconds' (meaning that they were flawed). The seconds were sold for $100 each at a factory outlet store. The remaining 102 garments were sold to retail outlets at a price of $198 per garment. What was the labor productivity, in dollars per labor-hour, at this job shop during the first week of March? Labor productivity =______ dollars/labor hour (round your response to two decimal places). Please don't just send the answer, I need to know how to do this. ThanksMark's Ceramics spent $4000 on a new kiln last year in the belief that it would cut energy usage 25% over the old kiln. This kiln is an oven that turns "greenware" into finished pottery. Mark is concerned that the new kiln requires extra labor hours for its operation. Mark wants to check the energy savings of the new oven, and also to look over other measures of their productivity to see if the change really was beneficial. Mark has the following data to work with: Last Year This Year Production (finished units) 4000 4000 Greenware (pounds) 5000 5000 Labor (hrs) 350 375 Capital ($) 15000 19000 Energy (kWh) 3000 2600 Were the modifications beneficial?Mance Fraily, the Production Manager at Ralts Mills, can currently expect his operation to produce 1000 square yards of fabric for each ton of raw cotton. Each ton of raw cotton requires 5 labor hours to process. He believes that he can buy a better-quality raw cotton, which will enable him to produce 1200 square yards per ton of raw cotton with the same labor hours. What will be the impact on productivity (measured in square yards per labor-hour) if he purchases the higher quality raw cotton?
- Mark Tuan, the Production Manager at MT Mills, can currently expect his operation to produce1000 square yards of fabric for each ton of raw cotton. Each ton of raw cotton requires 5 laborhours to process. He believes that he can buy a better-quality raw cotton, which will enable himto produce 1200 square yards per ton of raw cotton with the same labor hours.What will be the impact on productivity (measured in square yards per labor-hour) if hepurchases the higher quality raw cotton? You are required to calculate: a) Productivity for the current raw cotton? b) The new productivity if Mark Tuan use the new raw cotton. c) What is the percentage increase in productivity?In December, General Motors produced 6,600 customizedvans at its plant in Detroit. The labor productivity at thisplant is known to have been 0.10 vans per labor-hour during thatmonth. 300 laborers were employed at the plant that month.a) How many hours did the average laborer work that month?b) If productivity can be increased to 0.11 vans per laborhour,how many hours would the average laborer work thatmonth?1. A small furniture shop that focuses on making kitchen chairs produces 20,000 kitchen chairs annually. The shop is considering purchasing a new sanding machine; the machine will enable the workers to produce 30,000 chairs annually. Should the furniture shop proceed with the purchase of the new machine? a. Yes, the new machine would increase the labor productivity by 25%. b. Yes, the new machine would increase the labor productivity by 50%. c. No, the new machine would decrease the labor productivity by 50%. d. No, the new machine would increase the labor productivity by 25%. 2. Recently, Samsung released their latest flagship product, the S20. Which of the following best describes this technological development? a. General Purpose Technology b. New Invention c. Product Innovation d. Process Innovation 3. Moss is a casual video gamer. He is always curious on how do bots work in video games and how are they designed. Bots…
- Rushing yardage for three Heisman Trophy candidates is given below. Which candidate is the most productive run-ning back? How did you measure productivity? Candidates Hall Walker DayneRushing yards 2110 3623 6925No. of carries 105 875 1186No. of touchdowns 15 20 70ABC Insurance Ltd. wants to evaluate its labor and multifactor productivity with a new computerized title-search system. The company has a staff of four, each working 8 hours per day (for a payroll cost of $630/day) and overhead expenses of $450 per day. Collins processes and closes on 7 titles each day. The new computerized title-search system will allow the processing of 13 titles per day. Although the staff, their work hours, and pay are the same, the overhead expenses are now $900 per day. Calculatea) single factor productivity with old systemb) multi factor productivity with old systemc) ) single factor productivity with new systemd) multi factor productivity with new systemMariah Enterprises makes a variety of consumer electronicproducts. Its camera manufacturing plant is consideringchoosing between two different processes, named Alphaand Beta, which can be used to make two component partsA and B. To make the correct decision, the managers wouldlike to compare the labor and multifactor productivity ofprocess Alpha with that of process Beta. The value of processoutput for component A and B are $175 and $140 per unit,respectively. The corresponding overhead costs are $6,000and $5,000, respectively Process Alpha Process BetaProduct A B A BOutput (units) 50 60 30 80Labor ($) $1,200 $1,400 $1,000 $2,000Material ($) $2,500 $3,000 $1,400 $3,500a. Which process, Alpha or Beta, is more productive?b. What conclusions can you draw from your analysis?