Consider the five number summary for salaries of U.S. marketing managers. Min Q1 Median Q3 Max 46460 69792 77020 91760 129520 Suppose the marketing manager who was earning $129,520 got a raise and is now earning $150,000. Which of the following statement is true?
Consider the five number summary for salaries of U.S. marketing managers. Min Q1 Median Q3 Max 46460 69792 77020 91760 129520 Suppose the marketing manager who was earning $129,520 got a raise and is now earning $150,000. Which of the following statement is true?

Glencoe Algebra 1, Student Edition, 9780079039897, 0079039898, 2018
18th Edition
ISBN:9780079039897
Author:Carter
Publisher:Carter
Chapter10: Statistics
Section: Chapter Questions
Problem 13PT

Related questions
Question
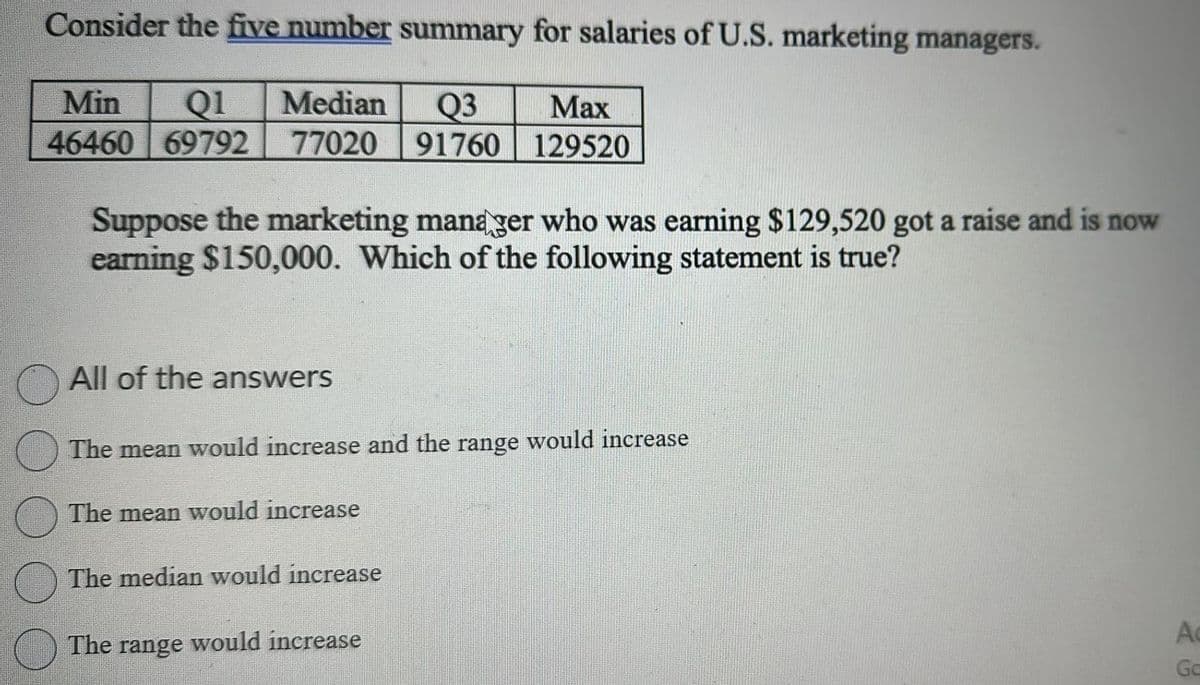
Transcribed Image Text:Consider the five number summary for salaries of U.S. marketing managers.
Min Q1 Median Q3
Max
46460 69792 77020 91760 129520
Suppose the marketing manager who was earning $129,520 got a raise and is now
earning $150,000. Which of the following statement is true?
All of the answers
The mean would increase and the range would increase
The mean would increase
The median would increase
The range would increase
Ac
Go
Expert Solution
This question has been solved!
Explore an expertly crafted, step-by-step solution for a thorough understanding of key concepts.

Step by step
Solved in 3 steps with 2 images

Recommended textbooks for you
Glencoe Algebra 1, Student Edition, 9780079039897…
Algebra
ISBN:
9780079039897
Author:
Carter
Publisher:
McGraw Hill
Glencoe Algebra 1, Student Edition, 9780079039897…
Algebra
ISBN:
9780079039897
Author:
Carter
Publisher:
McGraw Hill