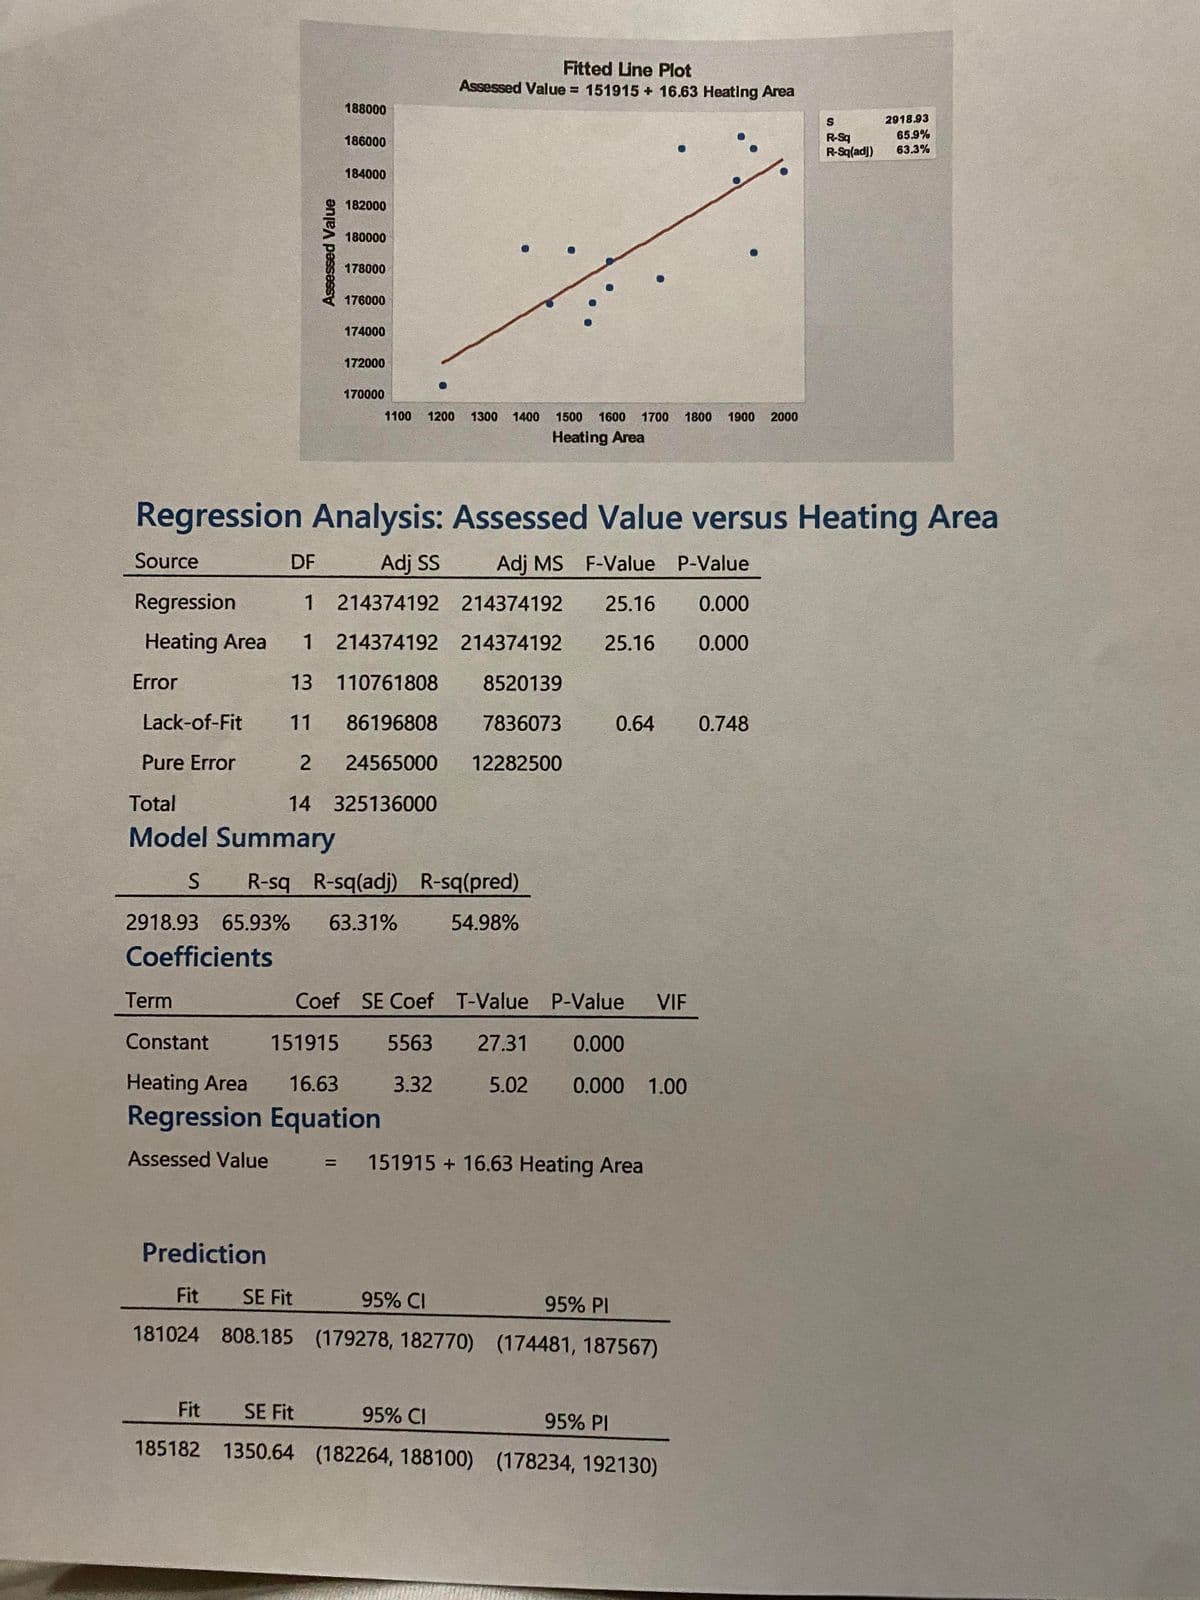
Simple Regression Analysis We want to develop a regression model to predict the assessed value of houses based on the heating area of houses in square feet. A sample of 15 single-family houses in the Kalamazoo area is selected. The assessed value in dollars and the heating area of the houses in square feet are recorded and stored in the data set House 3 (in the class Minitab Files folder). We are not using the Age in years column. House Assessed Value in $ Heating Area of house in sq ft Age in years 1 184400 2000 54 2 177400 1710 11.50 3 175700 1450 8.33 4 185900 1760 0.00 5 179100 1930 7.42 6 170400 1200 32 7 175800 1550 16 8 185900 1930 2 9 178500 1590 1.75 10 179200 1500 2.75 11 186700 1900 0.00 12 179300 1390 0.00 13 174500 1540 12.58 14 183800 1890 2.75 15 176800 1590 7.17 1. Determine a 95% interval estimate for the assessed value of a home with 1750 sq. ft. of heating area. 2. What is the strength of the linear relationship between assessed value and heating area?


Correlation
Correlation defines a relationship between two independent variables. It tells the degree to which variables move in relation to each other. When two sets of data are related to each other, there is a correlation between them.
Linear Correlation
A correlation is used to determine the relationships between numerical and categorical variables. In other words, it is an indicator of how things are connected to one another. The correlation analysis is the study of how variables are related.
Regression Analysis
Regression analysis is a statistical method in which it estimates the relationship between a dependent variable and one or more independent variable. In simple terms dependent variable is called as outcome variable and independent variable is called as predictors. Regression analysis is one of the methods to find the trends in data. The independent variable used in Regression analysis is named Predictor variable. It offers data of an associated dependent variable regarding a particular outcome.
Simple
We want to develop a regression model to predict the assessed value of houses based on the heating area of houses in square feet. A sample of 15 single-family houses in the Kalamazoo area is selected. The assessed value in dollars and the heating area of the houses in square feet are recorded and stored in the data set House 3 (in the class Minitab Files folder). We are not using the Age in years column.
|
House |
Assessed Value in $ |
Heating Area of house in sq ft |
Age in years |
|
1 |
184400 |
2000 |
54 |
|
2 |
177400 |
1710 |
11.50 |
|
3 |
175700 |
1450 |
8.33 |
|
4 |
185900 |
1760 |
0.00 |
|
5 |
179100 |
1930 |
7.42 |
|
6 |
170400 |
1200 |
32 |
|
7 |
175800 |
1550 |
16 |
|
8 |
185900 |
1930 |
2 |
|
9 |
178500 |
1590 |
1.75 |
|
10 |
179200 |
1500 |
2.75 |
|
11 |
186700 |
1900 |
0.00 |
|
12 |
179300 |
1390 |
0.00 |
|
13 |
174500 |
1540 |
12.58 |
|
14 |
183800 |
1890 |
2.75 |
|
15 |
176800 |
1590 |
7.17 |
1. Determine a 95%
2. What is the strength of the linear relationship between assessed value and heating area?


Trending now
This is a popular solution!

Step by step
Solved in 2 steps


