Verbal SAT as a Predictor of GPA A scatterplot with regression line is shown below for a regression model using Verbal SAT score, VerbalSAT, to predict grade poin average in college, GPA, using the data in StudentSurvey. We also show computer output of the regression analysis below. The regression equation is GPA = 2.03 +0.00189 VerbalSAT. Predictor Coef SE Coef T P Constant VerbalSAT 0.0018929 0.0002709 6.99 0.000 S = 0.373214 R - Sq = 12.5% R - Sq(adj) = 12.2% 2.0336 The test statistic is i The p-value is 0.000 Reject (e) What is R²? What is the conclusion of the test? R² = = i 0.1621 12.54 0.000 Ho. Interpret this in context. 600 VarhaICAT (d) What is the test statistic for a test of the slope? What is the p-value? GPA % 4.0 3.5 3.0 2.5 2.0 400 500 700 800
Verbal SAT as a Predictor of GPA A scatterplot with regression line is shown below for a regression model using Verbal SAT score, VerbalSAT, to predict grade poin average in college, GPA, using the data in StudentSurvey. We also show computer output of the regression analysis below. The regression equation is GPA = 2.03 +0.00189 VerbalSAT. Predictor Coef SE Coef T P Constant VerbalSAT 0.0018929 0.0002709 6.99 0.000 S = 0.373214 R - Sq = 12.5% R - Sq(adj) = 12.2% 2.0336 The test statistic is i The p-value is 0.000 Reject (e) What is R²? What is the conclusion of the test? R² = = i 0.1621 12.54 0.000 Ho. Interpret this in context. 600 VarhaICAT (d) What is the test statistic for a test of the slope? What is the p-value? GPA % 4.0 3.5 3.0 2.5 2.0 400 500 700 800

Glencoe Algebra 1, Student Edition, 9780079039897, 0079039898, 2018
18th Edition
ISBN:9780079039897
Author:Carter
Publisher:Carter
Chapter4: Equations Of Linear Functions
Section4.6: Regression And Median-fit Lines
Problem 22PFA

Related questions
Question
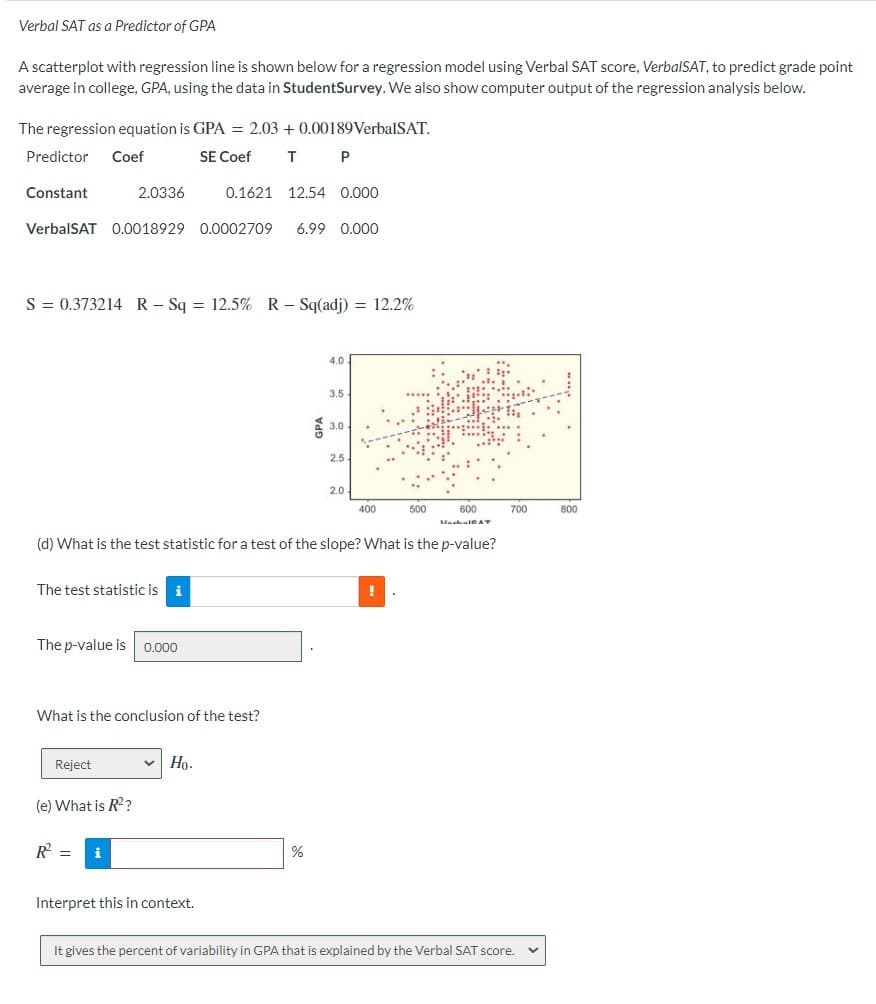
Transcribed Image Text:Verbal SAT as a Predictor of GPA
A scatterplot with regression line is shown below for a regression model using Verbal SAT score, VerbalSAT, to predict grade point
average in college, GPA, using the data in StudentSurvey. We also show computer output of the regression analysis below.
The regression equation is GPA = 2.03 +0.00189 VerbalSAT.
Predictor Coef
SE Coef T
Constant
VerbalSAT 0.0018929 0.0002709 6.99 0.000
2.0336
S = 0.373214 R-Sq = 12.5% R - Sq(adj) = 12.2%
The test statistic is i
The p-value is 0.000
Reject
What is the conclusion of the test?
(e) What is R²?
R² =
i
0.1621 12.54 0.000
P
V Ho.
Interpret this in context.
(d) What is the test statistic for a test of the slope? What is the p-value?
%
4.0
3.5.
3.0
2.5
2.0
400
500
!
600
Varhale AT
700
It gives the percent of variability in GPA that is explained by the Verbal SAT score.
800
Expert Solution
This question has been solved!
Explore an expertly crafted, step-by-step solution for a thorough understanding of key concepts.

This is a popular solution!

Trending now
This is a popular solution!

Step by step
Solved in 2 steps with 2 images

Recommended textbooks for you
Glencoe Algebra 1, Student Edition, 9780079039897…
Algebra
ISBN:
9780079039897
Author:
Carter
Publisher:
McGraw Hill


Functions and Change: A Modeling Approach to Coll…
Algebra
ISBN:
9781337111348
Author:
Bruce Crauder, Benny Evans, Alan Noell
Publisher:
Cengage Learning
Glencoe Algebra 1, Student Edition, 9780079039897…
Algebra
ISBN:
9780079039897
Author:
Carter
Publisher:
McGraw Hill
Functions and Change: A Modeling Approach to Coll…
Algebra
ISBN:
9781337111348
Author:
Bruce Crauder, Benny Evans, Alan Noell
Publisher:
Cengage Learning

College Algebra
Algebra
ISBN:
9781305115545
Author:
James Stewart, Lothar Redlin, Saleem Watson
Publisher:
Cengage Learning

Algebra and Trigonometry (MindTap Course List)
Algebra
ISBN:
9781305071742
Author:
James Stewart, Lothar Redlin, Saleem Watson
Publisher:
Cengage Learning