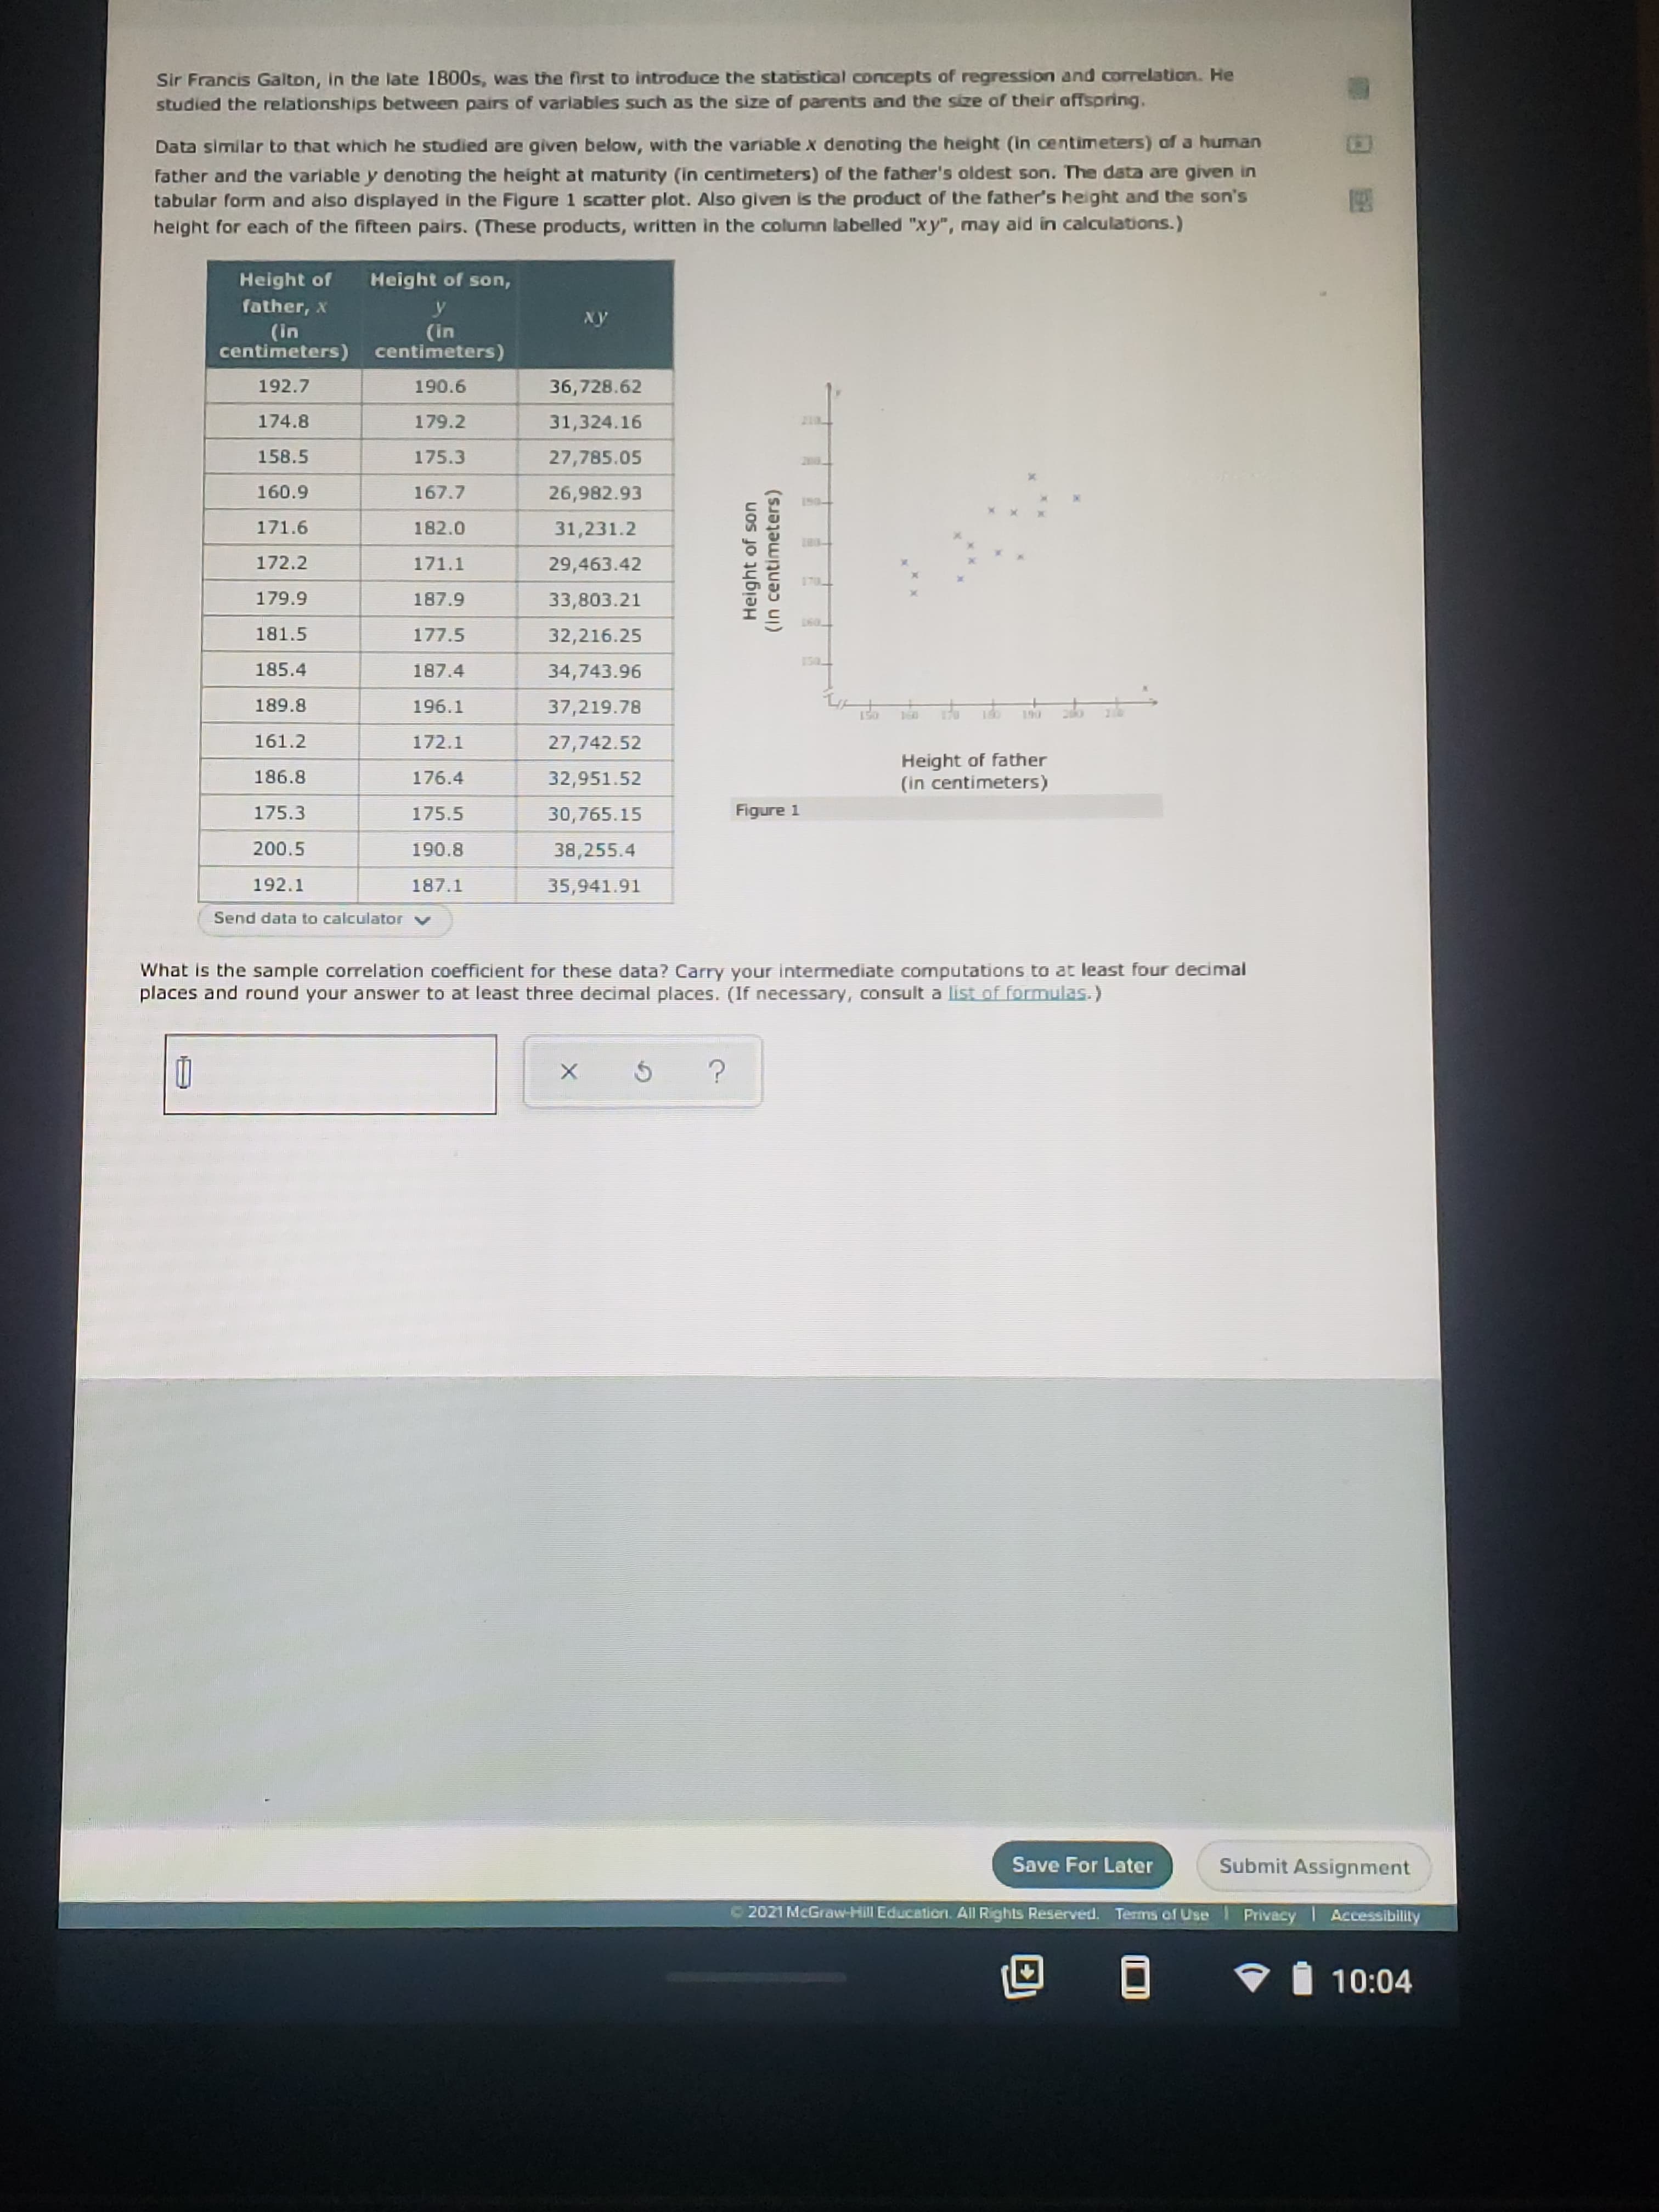
Sir Francis Galton, in the late 1800s, was the first to introduce the statistical concepts of regression and correlation. He studied the relationships between pairs of varlables such as the size of parents and the size of their affspring. Data similar to that which he studied are given below, with the variable x denoting the height (in centimeters) of a human father and the variable y denoting the height at maturity (in centimeters) of the father's oldest son. The data are given in tabular form and also displayed in the Figure 1 scatter plot. Also given is the product of the father's height and the son's helght for each of the fifteen pairs. (These products, written in the column labelled "xy", may aid in calculations.) Height of Height of son, father, x y (in centimeters) centimeters) xy (in 192.7 190.6 36,728.62 174.8 179.2 31,324.16 210 158.5 175.3 27,785.05 200 160.9 167.7 26,982.93 180- 171.6 182.0 31,231.2 172.2 171.1 29,463.42 170 179.9 187.9 33,803.21 181.5 177.5 32,216.25 130_ 185.4 187.4 34,743.96 189.8 196.1 37,219.78 150 190 161.2 172.1 27,742.52 Height of father (in centimeters) 186.8 176.4 32,951.52 175.3 175.5 30,765.15 Figure 1 200.5 190.8 38,255.4 192.1 187.1 35,941.91 Send data to calculator What is the sample correlation coefficient for these data? Carry your intermediate computations to at least four decimal places and round your answer to at least three decimal places. (If necessary, consult a list of formulas.) Height of son (In centimeters)


Correlation
Correlation defines a relationship between two independent variables. It tells the degree to which variables move in relation to each other. When two sets of data are related to each other, there is a correlation between them.
Linear Correlation
A correlation is used to determine the relationships between numerical and categorical variables. In other words, it is an indicator of how things are connected to one another. The correlation analysis is the study of how variables are related.
Regression Analysis
Regression analysis is a statistical method in which it estimates the relationship between a dependent variable and one or more independent variable. In simple terms dependent variable is called as outcome variable and independent variable is called as predictors. Regression analysis is one of the methods to find the trends in data. The independent variable used in Regression analysis is named Predictor variable. It offers data of an associated dependent variable regarding a particular outcome.


Trending now
This is a popular solution!

Step by step
Solved in 2 steps


