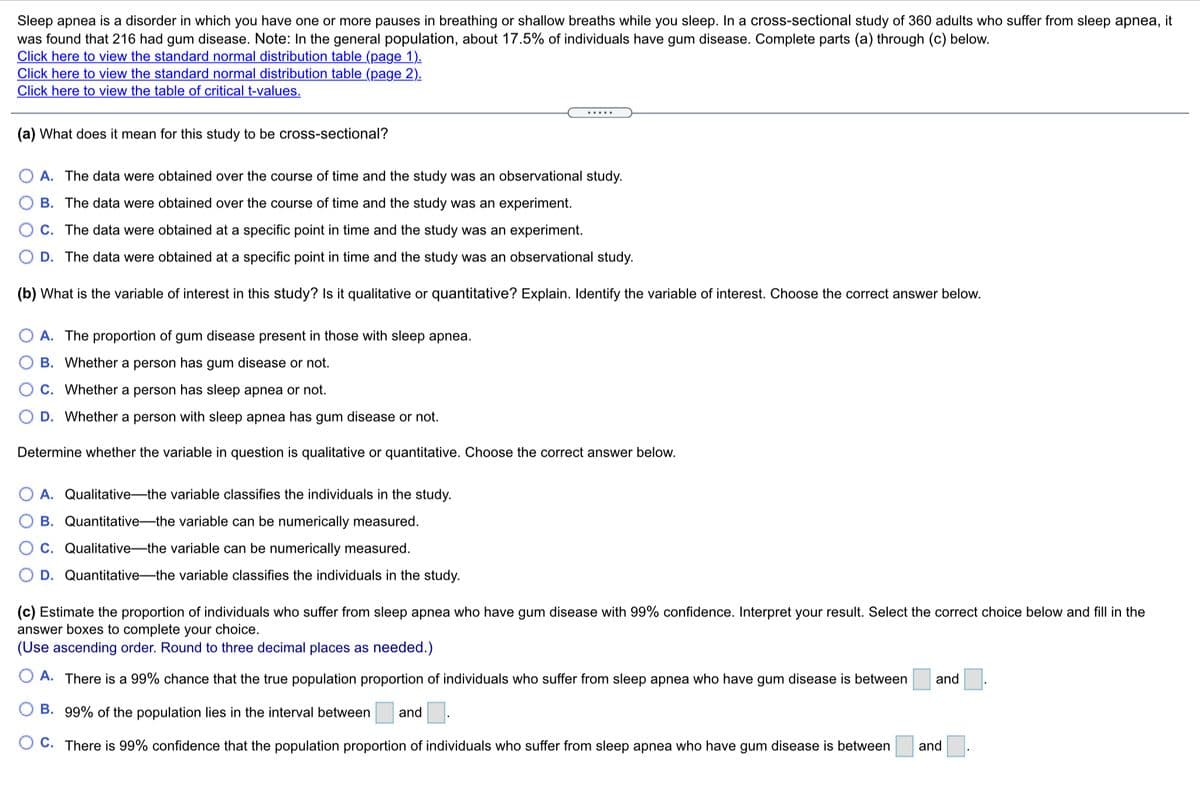
Sleep apnea is a disorder in which you have one or more pauses in breathing or shallow breaths while you sleep. In a cross-sectional study of 360 adults who suffer from sleep apnea, it was found that 216 had gum disease. Note: In the general population, about 17.5% of individuals have gum disease. Complete parts (a) through (c) below. Click here to view the standard normal distribution table (page 1). Click here to view the standard normal distribution table (page 2). Click here to view the table of critical t-values. ..... (a) What does it mean for this study to be cross-sectional? O A. The data were obtained over the course of time and the study was an observational study. O B. The data were obtained over the course of time and the study was an experiment. OC. The data were obtained at a specific point in time and the study was an experiment. O D. The data were obtained at a specific point in time and the study was an observational study. (b) What is the variable of interest in this study? Is it qualitative or quantitative? Explain. Identify the variable of interest. Choose the correct answer below. O A. The proportion of gum disease present in those with sleep apnea. O B. Whether a person has gum disease or not. O C. Whether a person has sleep apnea or not. O D. Whether a person with sleep apnea has gum disease or not. Determine whether the variable in question is qualitative or quantitative. Choose the correct answer below. O A. Qualitative-the variable classifies the individuals in the study. O B. Quantitative-the variable can be numerically measured. OC. Qualitative-the variable can be numerically measured. O D. Quantitative-the variable classifies the individuals in the study. (c) Estimate the proportion of individuals who suffer from sleep apnea who have gum disease with 99% confidence. Interpret your result. Select the correct choice below and fill in the answer boxes to complete your choice. (Use ascending order. Round to three decimal places as needed.) O A. There is a 99% chance that the true population proportion of individuals who suffer from sleep apnea who have gum disease is between and O B. 99% of the population lies in the interval between and O C. There is 99% confidence that the population proportion of individuals who suffer from sleep apnea who have gum disease is between and
Sleep apnea is a disorder in which you have one or more pauses in breathing or shallow breaths while you sleep. In a cross-sectional study of 360 adults who suffer from sleep apnea, it was found that 216 had gum disease. Note: In the general population, about 17.5% of individuals have gum disease. Complete parts (a) through (c) below. Click here to view the standard normal distribution table (page 1). Click here to view the standard normal distribution table (page 2). Click here to view the table of critical t-values. ..... (a) What does it mean for this study to be cross-sectional? O A. The data were obtained over the course of time and the study was an observational study. O B. The data were obtained over the course of time and the study was an experiment. OC. The data were obtained at a specific point in time and the study was an experiment. O D. The data were obtained at a specific point in time and the study was an observational study. (b) What is the variable of interest in this study? Is it qualitative or quantitative? Explain. Identify the variable of interest. Choose the correct answer below. O A. The proportion of gum disease present in those with sleep apnea. O B. Whether a person has gum disease or not. O C. Whether a person has sleep apnea or not. O D. Whether a person with sleep apnea has gum disease or not. Determine whether the variable in question is qualitative or quantitative. Choose the correct answer below. O A. Qualitative-the variable classifies the individuals in the study. O B. Quantitative-the variable can be numerically measured. OC. Qualitative-the variable can be numerically measured. O D. Quantitative-the variable classifies the individuals in the study. (c) Estimate the proportion of individuals who suffer from sleep apnea who have gum disease with 99% confidence. Interpret your result. Select the correct choice below and fill in the answer boxes to complete your choice. (Use ascending order. Round to three decimal places as needed.) O A. There is a 99% chance that the true population proportion of individuals who suffer from sleep apnea who have gum disease is between and O B. 99% of the population lies in the interval between and O C. There is 99% confidence that the population proportion of individuals who suffer from sleep apnea who have gum disease is between and

MATLAB: An Introduction with Applications
6th Edition
ISBN:9781119256830
Author:Amos Gilat
Publisher:Amos Gilat
Chapter1: Starting With Matlab
Section: Chapter Questions
Problem 1P

Related questions
Question
100%
Transcribed Image Text:Sleep apnea is a disorder in which you have one or more pauses in breathing or shallow breaths while you sleep. In a cross-sectional study of 360 adults who suffer from sleep apnea, it
was found that 216 had gum disease. Note: In the general population, about 17.5% of individuals have gum disease. Complete parts (a) through (c) below.
Click here to view the standard normal distribution table (page 1).
Click here to view the standard normal distribution table (page 2).
Click here to view the table of critical t-values.
.....
(a) What does it mean for this study to be cross-sectional?
O A. The data were obtained over the course of time and the study was an observational study.
B. The data were obtained over the course of time and the study was an experiment.
C. The data were obtained at a specific point in time and the study was an experiment.
D. The data were obtained at a specific point in time and the study was an observational study.
(b) What is the variable of interest in this study? Is it qualitative or quantitative? Explain. Identify the variable of interest. Choose the correct answer below.
A. The proportion of gum disease present in those with sleep apnea.
B. Whether a person has gum disease or not.
C. Whether a person has sleep apnea or not.
D. Whether a person with sleep apnea has gum disease or not.
Determine whether the variable in question is qualitative or quantitative. Choose the correct answer below.
A. Qualitative-the variable classifies the individuals in the study.
B. Quantitative-the variable can be numerically measured.
C. Qualitative-the variable can be numerically measured.
D. Quantitative-the variable classifies the individuals in the study.
(c) Estimate the proportion of individuals who suffer from sleep apnea who have gum disease with 99% confidence. Interpret your result. Select the correct choice below and fill in the
answer boxes to complete your choice.
(Use ascending order. Round to three decimal places as needed.)
A. There is a 99% chance that the true population proportion of individuals who suffer from sleep apnea who have gum disease is between
and
B. 99% of the population lies in the interval between
and
O C. There is 99% confidence that the population proportion of individuals who suffer from sleep apnea who have gum disease is between
and
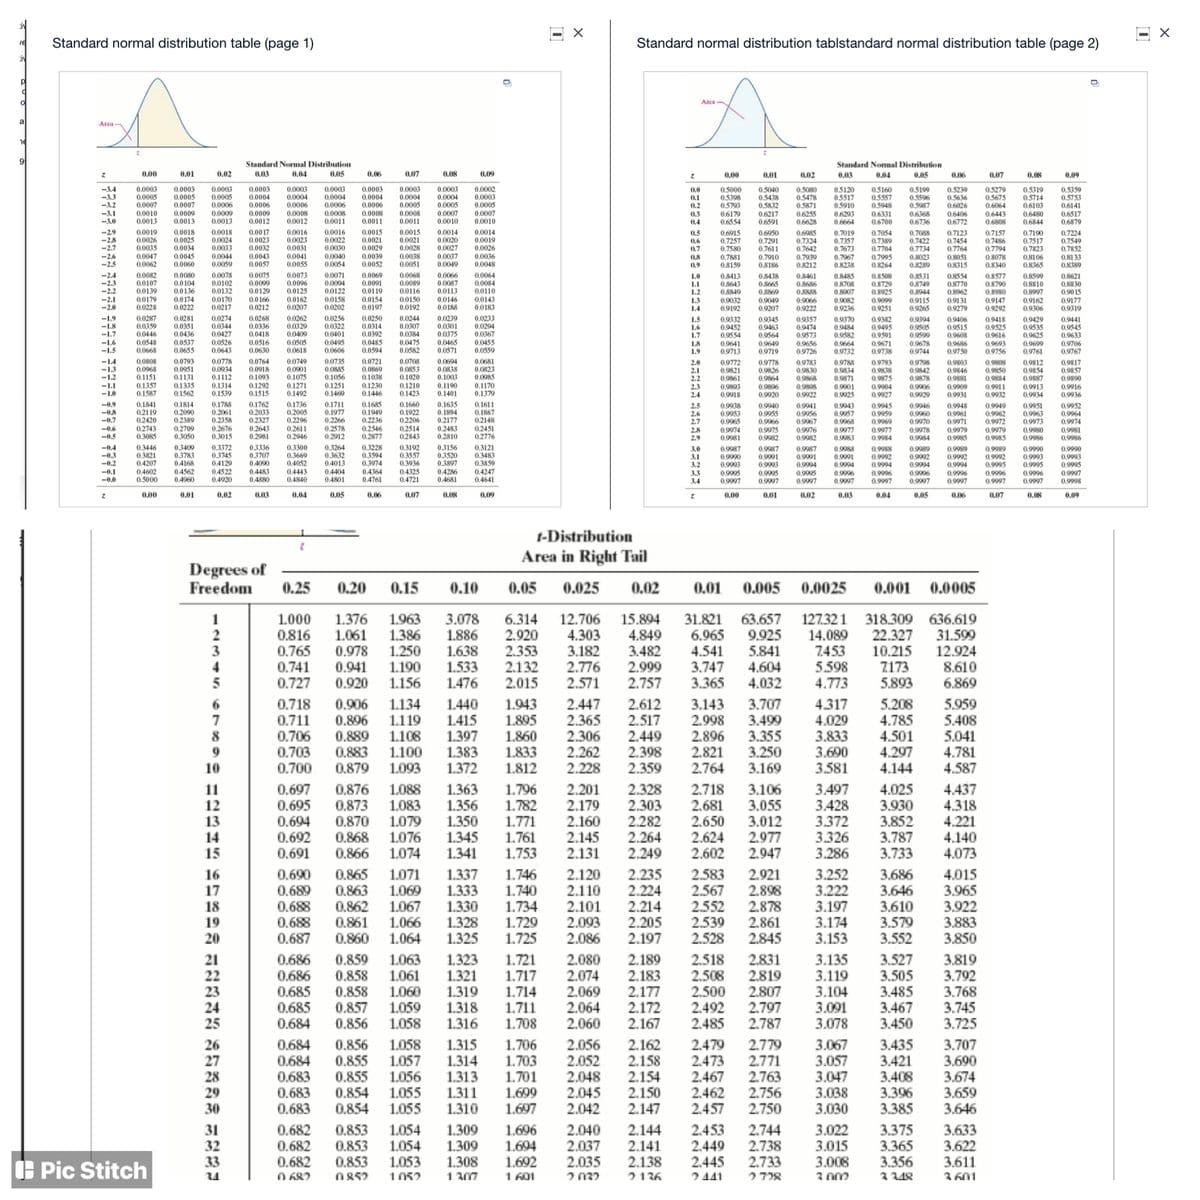
Transcribed Image Text:Standard normal distribution table (page 1)
Standard normal distribution tablstandard normal distribution table (page 2)
tiv
Aca
Area
16
9
Standard Normal Distribution
Standard Nomal Distribution
0.00
0.01
0.02
0.03
0.04
0.05
0.06
0.07
0.08
0,09
0.00
0.01
0.02
0,03
0.04
0.05
0.06
0.07
0.08
0.09
0.0003
0.0005
0.0007
0.0003
0.0005
0.0006
0.0003
0.0004
0.0006
0.0003
0.0004
0.0006
0.5000
0.5398
0.5793
0.5080
0.5478
0.5871
0.0003
-3.4
-33
-3.2
-3.1
-3.0
0.0003
0.0005
0.0007
0,0003
0.0004
0.0006
0.0003
0.0004
0.0005
0.0008
0.0011
0.0003
0.0004
0.0005
0.0007
0.0010
0.0002
0.0003
0.0005
0.5040
0.5438
0.5832
05120
0.5517
0.5910
0.5160
0.5557
0.5948
0,5199
0.5596
0.5987
0.5279
0.5675
0.6064
0,5359
0.5753
0.6141
0.5239
0.0
0.1
0.2
0.5319
0.5714
0.6103
0.6480
0.0004
0.0006
0.5636
0.6026
0.0010
0.0013
0.0009
0.0013
0.0009
0.0013
0.0009
0.0012
0.0008
0.0012
0.0008
0.0011
0.0008
0.0011
0.0007
0.0010
0.3
0.4
0.6179
0.6554
0,6217
0.6591
0.6255
0.6628
0.6293
0.6664
0.6331
0.6700
06368
0.6736
0.6406
0.6772
0.6443
0.6808
0.6517
0.6879
0,6844
0.0019
0.0026
0.0015
0.0021
-29
-28
-2.7
0.0018
0.0025
0.0034
0.0045
0.0060
0.0018
0.0024
0.0033
0.0044
0.0059
0.0017
0.0023
0.0032
0.0043
0.0057
0.0016
0.0023
0.0031
0.0016
0.0022
0.0030
0.0040
0.0054
0.0015
0.0021
0.0029
0.0039
0.0052
0.0014
0.0020
0.0027
0.0037
0.0049
0.0014
0.0019
0.0026
0.0036
0.0048
0.6915
0.7257
0.7580
0.7881
0.8159
0.6950
0.7291
0.7611
0.7910
0.8186
0.7019
0.7357
0.7673
0.7967
0.8238
0.7054
0.7389
0.7704
0.7995
0.8264
0.7088
0.7422
0.7734
0.8023
0.8289
0.7157
0.7486
0.7794
0.8078
0.8340
0.7190
0.7517
0.7823
0.5
0.6985
0.7324
0.7642
0.7939
0.8212
0.7123
0.7454
0,7764
0.7224
0.7549
0.7852
0.8133
0.8389
0.6
0.0035
0.0047
0.0062
0.0028
0.0038
0.0051
0.7
-2.6
-2.5
0.0041
0.0055
0.8051
0.8315
0.8
0.8106
0.8365
0.9
-24
-2.3
-2.2
0.0082
0.0107
0.0139
0.0179
0.0228
0.0080
0.0104
0.0136
0.0078
0.0102
0.0132
0.0170
0.0217
0.0071
0.0094
0.0122
0.0158
0.0202
0.0075
0.0099
0.0073
0.0096
0.0125
0.0162
0.0207
0.0069
0.0091
0.0119
0.0068
0.0089
0.0116
0.0066
0.0087
0.0113
0.0064
0.0084
0.0110
1.0
1.1
1.2
1.3
1.4
0.8508
0.8729
0.8925
0.9099
0.8413
0.8643
0.0129
0.0166
0.0212
0.8438
0.8665
0.8869
0.9049
0.9207
0.8461
0.8686
0.8888
0.9066
0.9222
0.8485
0.8708
0.8907
0.8531
0.8749
0.8944
0.9115
0.9265
0.8554
0.8770
0.8962
0,9131
0.9279
0.8577
0.8790
0.8980
0.8599
0.8810
0.8997
0.8621
0.8830
0.90 15
0.9177
0.9319
0.8849
-2.1
-2.0
0.0174
0.0222
0.0154
0.0197
0.0150
0.0192
0.0146
0.0188
0.0143
0.0183
0.9082
0.9236
0.9147
0.9292
0.9032
0.9162
0.9306
0.9192
0.9251
-1.9
-1.8
-1.7
0.0287
0.0359
0.0446
0.0548
0.0668
0.0281
0.0351
0.0436
0.0537
0.0655
0.0274
0.0344
0.0427
0.0526
0.0643
0.0268
0.0336
0.0418
0.0516
0.0630
0.0262
0.0329
0.0409
0.0505
0.0618
0.0256
0.0322
0.0401
0.0495
0.0606
0.0250
0.0314
0.0392
0.0485
0,0594
0.0244
0.0307
0.0384
0.0475
0.0582
0.0239
0.0301
0.0375
0.0465
0.0571
0.0233
0.0204
0.0367
0.0455
0.0559
1.5
1.6
1.7
0.9332
0.9452
0.9554
0.9641
0.9713
0.9345
0.9463
0.9564
0.9357
0.9474
0.9573
0.9370
0.9484
0.9582
0.9382
0.9495
0.9591
0.9394
0.9505
0.9599
0.9406
0.9515
0.9608
0.9418
0.9525
0.9616
0.9693
0.9756
0.9429
0,9535
0.9625
0.9699
0.9761
0.9441
0.9545
0.9633
0.9706
0.9767
-1.6
-1.5
1.8
1.9
0.9649
0.9719
0.9656
0.9726
0.9664
0.9732
0.9671
0.9738
0.9678
0.9744
0.9686
0.9750
-14
-1.3
-1.2
-1.1
-1.0
0.0793
0.0951
0.1131
0.0778
0.0934
0.1112
0.1314
0.1539
0.0735
0.0885
0.1056
0.0721
0.0869
0.1038
0.1230
0.1446
0.0708
0.0853
0.1020
0.0808
0.0764
0.0918
0.1093
0.1292
0.1515
0.0749
0.0901
0.1075
0.1271
0.1492
0.0694
0.0838
0.1003
0.0681
0.0823
0.0985
2.0
2.1
2.2
0.9772
0.9821
0.9861
0.9893
0.9918
0.9778
0.9783
0.9830
0.9868
0.9788
0.9834
0.9871
0.9793
0.9838
0.9875
0.9904
0.9927
0.9798
0.9803
0.9846
0.9881
0.9909
0.9931
0.9812
0.9854
0.9887
0,9817
0.9857
0.9890
0.9808
0.9850
0.9884
0.0968
0.9826
0.9864
0.9842
0.9878
0.1151
0.1357
0.1587
0.1335
0.1562
0.1251
0.1469
0.1210
0.1423
0.1190
0.1401
0.1170
0.1379
2.3
2.4
0.9896
0.9920
0.9898
0.9922
0.9901
0.9925
0.9906
0.9929
0.9911
0.9932
0.9913
0.9916
0.9936
0.9934
-0,9
-08
-0.7
-0.6
-0.5
0.1841
0.2119
0.2420
0.2743
0.3085
0.1814
0.2090
0.2389
0.2709
0.3050
0.1788
0.2061
0.2358
0.2676
0.3015
0.1762
0.2033
0.2327
0.2643
0.2981
0.1736
0.2005
0.2296
0.2611
0.2946
0.1711
0.1977
0.2266
0.2578
0.2912
0.1685
0.1949
0.2236
0.2546
0.2877
0.1660
0.1922
0.2206
0.2514
0.2843
0.1635
0.1894
0.2177
0.2483
0.2810
0.1611
0.1867
0.2148
0.2451
0.2776
2.5
2.6
2.7
2.8
2.9
0.9938
0.9953
0.9965
0.9940
0.9955
0.9966
0.9941
0.9956
0.9967
0.9943
0.9957
0.9968
0.9977
0.9983
0.9945
0.9959
0.9969
0.9977
0.9984
0.9946
0.9960
0.9970
0.9978
0.9984
0.9948
0.9961
0.9971
0.9979
0.9985
0.9949
0.9962
0.9972
0.9979
0.9985
0.9951
0.9963
0.9973
0.9952
0.9964
0.9974
0.9981
0.9986
0.9974
0.9981
0.9975
0.9982
0.9976
0.9980
0.9986
0.9982
-04
-0.3
-0.2
0.3446
0.3821
0.4207
0.3409
0.3783
04168
0.3372
0.3745
0.4129
0.4522
0.4920
0.3336
0.3707
0.4090
0.3300
0.3669
0.4052
0.3264
0.3632
0.4013
0.3228
0.3594
0.3974
0,3192
0.3557
0.3936
0.4325
0.4721
0.3156
0.3520
0.3897
0.3121
0.3483
0.3859
0.9987
0.9991
0.9993
0.9995
0.9997
0.9987
0.9991
0.9994
0.9995
0.9997
0.9989
0.9992
0.9995
0.9989
0.9990
0.9993
0.9995
0.9996
0.9997
0.9987
0.9988
0.9992
0.9994
3,0
0.9990
0.9993
0.9995
0.9997
0.9988
0.9991
0.9994
0.9996
0.9997
0.9989
0.9992
0.9994
0.9990
0.9993
0.9995
0.9997
0.9998
3.1
0.9992
0.9994
3.2
-0.1
-0.0
0.4602
0.5000
0,4562
0.4960
0.4483
0.4880
0.4443
0.4840
0.4404
0.4801
0.4364
04761
0,4286
0.4681
0.4247
3.3
3.4
0.9996
0.9997
0.9996
0.9997
0.9996
0.9997
0.9996
0.4641
0.9997
0.00
0.01
0.02
0.03
0.04
0,05
0.06
0.07
0,08
0,09
0.00
0.01
0.02
0.03
0,04
0,05
0.06
0.07
0.08
0.09
t-Distribution
Area in Right Tail
Degrees of
Freedom
0.25
0.20
0.15
0.10
0.05
0.025
0.02
0.01
0.005
0.0025
0.001 0.0005
1.000
0.816
0.765
0.741
0.727
1.376
1.061
0.978
0.941
0.920
1.963
1.386
1.250
1.190
1.156
3.078
1.886
1.638
1.533
1.476
6.314
2.920
2.353
2.132
2.015
12.706
4.303
3.182
2.776
2.571
15.894
4.849
3.482
2.999
2.757
31.821
6.965
4.541
3.747
3.365
63.657
9.925
5.841
4.604
4.032
127.321
14.089
7453
5.598
4.773
318.309 636.619
22.327
10.215
7173
5.893
2
3
31.599
12.924
8.610
6.869
4
0.718
0.711
0.706
0.703
0.700
1.134
1.119
1.108
1.100
1.943
1.895
1.860
1.833
1.812
2.447
2.365
2.306
2.262
2.228
5.959
5.408
5.041
4.781
4.587
0.906
1.440
1.415
1.397
1.383
1.372
2.612
2.517
2.449
2.398
2.359
3.143
2.998
2.896
2.821
2.764
3.707
3.499
3.355
3.250
3.169
4.317
4.029
3.833
3.690
3.581
5.208
4.785
4.501
4.297
4.144
6
7
0.896
0.889
0.883
0.879
10
1.093
1.363
1.356
1.350
1.345
1.341
2.718
2.681
2.650
2.624
2.602
0.697
0.695
11
12
13
14
15
0.876
0.873
0.870
0.868
0.866
1.088
1.083
1.079
1.076
1.074
1.796
1.782
1.771
1.761
1.753
2.201
2.179
2.160
2.145
2.131
2.328
2.303
2.282
2.264
2.249
3.106
3.055
3.012
2.977
2.947
3.497
3.428
3.372
3.326
3.286
4.025
3.930
3.852
3.787
3.733
4.437
4.318
4.221
4.140
4.073
0.694
0.692
0.691
0.690
0.689
0.688
0.688
0.687
0.865
0.863
0.862
0.861
0.860
1.071
1.069
1.067
1.066
1.064
1.337
1.333
1.330
1.328
1.325
1.746
1.740
1.734
1.729
1.725
2.120
2.110
2.101
2.093
2.086
2.235
2.224
2.214
2.205
2.197
2.583
2.567
2.552
2.539
2.528
2.921
2.898
2.878
2.861
2.845
3.252
3.222
3.197
3.174
3.153
3.686
3.646
3.610
3.579
3.552
4.015
3.965
3.922
3.883
3.850
16
17
18
19
20
0.686
0.686
0.685
0.685
0.684
0.859
0.858
0.858
0.857
0.856
1.063
1.061
1.060
1.059
1.058
1.323
1.321
1.319
1.318
1.316
1.721
1.717
1.714
1.711
1.708
2.080
2.074
2.069
2.064
2.060
2.189
2.183
2.177
2.172
2.167
2.518
2.508
2.500
2.492
2.485
2.831
2.819
2.807
2.797
2.787
3.135
3.119
3.104
3.091
3.078
3.527
3.505
3.485
3.467
3.450
3.819
3.792
3.768
3.745
3.725
21
22
23
24
25
0.856
0.855
0.855
0.854
0.854
1.315
1.314
1.313
0.684
26
27
28
29
30
1.058
1.057
1.056
1.055
1.055
1.706
1.703
1.701
2.056
2.052
2.048
2.045
2.042
2.162
2.158
2.154
2.150
2.147
2.479
2.473
2.467
2.462
2.457
2.779
2.771
2.763
2.756
2.750
3.067
3.057
3.047
3.038
3.030
3.435
3.421
3.408
3.396
3.385
3.707
3.690
3.674
3.659
3.646
0.684
0.683
0.683
0.683
1.311
1.699
1.310
1.697
0.853
0.853
31
32
33
0.682
0.682
0.682
O 682
1.054
1.054
1.053
1.309
1.309
1.308
1 307
1.696
1.694
1.692
1 601
2.040
2.037
2.035
2032
2.144
2.141
2.138
21 36
2.453
2.449
2.445
2 441
2.744
2.738
2.733
3.022
3.015
3.008
3.375
3.365
3.356
3.633
3.622
3.611
3 601
0.853
O Pic Stitch
O852
1052
2728
2000
Expert Solution
This question has been solved!
Explore an expertly crafted, step-by-step solution for a thorough understanding of key concepts.

This is a popular solution!

Trending now
This is a popular solution!

Step by step
Solved in 3 steps with 5 images

Recommended textbooks for you
MATLAB: An Introduction with Applications
Statistics
ISBN:
9781119256830
Author:
Amos Gilat
Publisher:
John Wiley & Sons Inc

Probability and Statistics for Engineering and th…
Statistics
ISBN:
9781305251809
Author:
Jay L. Devore
Publisher:
Cengage Learning

Statistics for The Behavioral Sciences (MindTap C…
Statistics
ISBN:
9781305504912
Author:
Frederick J Gravetter, Larry B. Wallnau
Publisher:
Cengage Learning
MATLAB: An Introduction with Applications
Statistics
ISBN:
9781119256830
Author:
Amos Gilat
Publisher:
John Wiley & Sons Inc
Probability and Statistics for Engineering and th…
Statistics
ISBN:
9781305251809
Author:
Jay L. Devore
Publisher:
Cengage Learning
Statistics for The Behavioral Sciences (MindTap C…
Statistics
ISBN:
9781305504912
Author:
Frederick J Gravetter, Larry B. Wallnau
Publisher:
Cengage Learning

Elementary Statistics: Picturing the World (7th E…
Statistics
ISBN:
9780134683416
Author:
Ron Larson, Betsy Farber
Publisher:
PEARSON

The Basic Practice of Statistics
Statistics
ISBN:
9781319042578
Author:
David S. Moore, William I. Notz, Michael A. Fligner
Publisher:
W. H. Freeman

Introduction to the Practice of Statistics
Statistics
ISBN:
9781319013387
Author:
David S. Moore, George P. McCabe, Bruce A. Craig
Publisher:
W. H. Freeman