snhu thudent login - Search Home B3 Chailenge Activities Means X zy Section B.1 - MAT 240: Applied S X 6 https://learn.zybooks.com/zybook/MAT-240-14373-OL-TRAD-UG.22EW4/chapter/B/section/1?content resource... A a = zyBooks My library > MAT 240 Applied Statistics home > 8.1: Hypothesis tests for the difference between two population means zyBooks catalog Help/FAQ E 30707411676 day Jump to level 1 A middle school teacher believes that a reading rewards program results in less time to read a book after the program is completed. The teacher chooses a simple random sample of students and records the time taken to read a book before starting the program and after the program is completed. The results of the study are below. What are the population parameters? Pick defore After Mean Varlance Obsarvations 657 What is the level of significance? Ex 0.12 188740.293 170705172 100 100 Munorh
snhu thudent login - Search Home B3 Chailenge Activities Means X zy Section B.1 - MAT 240: Applied S X 6 https://learn.zybooks.com/zybook/MAT-240-14373-OL-TRAD-UG.22EW4/chapter/B/section/1?content resource... A a = zyBooks My library > MAT 240 Applied Statistics home > 8.1: Hypothesis tests for the difference between two population means zyBooks catalog Help/FAQ E 30707411676 day Jump to level 1 A middle school teacher believes that a reading rewards program results in less time to read a book after the program is completed. The teacher chooses a simple random sample of students and records the time taken to read a book before starting the program and after the program is completed. The results of the study are below. What are the population parameters? Pick defore After Mean Varlance Obsarvations 657 What is the level of significance? Ex 0.12 188740.293 170705172 100 100 Munorh

Algebra & Trigonometry with Analytic Geometry
13th Edition
ISBN:9781133382119
Author:Swokowski
Publisher:Swokowski
Chapter10: Sequences, Series, And Probability
Section10.7: Distinguishable Permutations And Combinations
Problem 29E

Related questions
Question
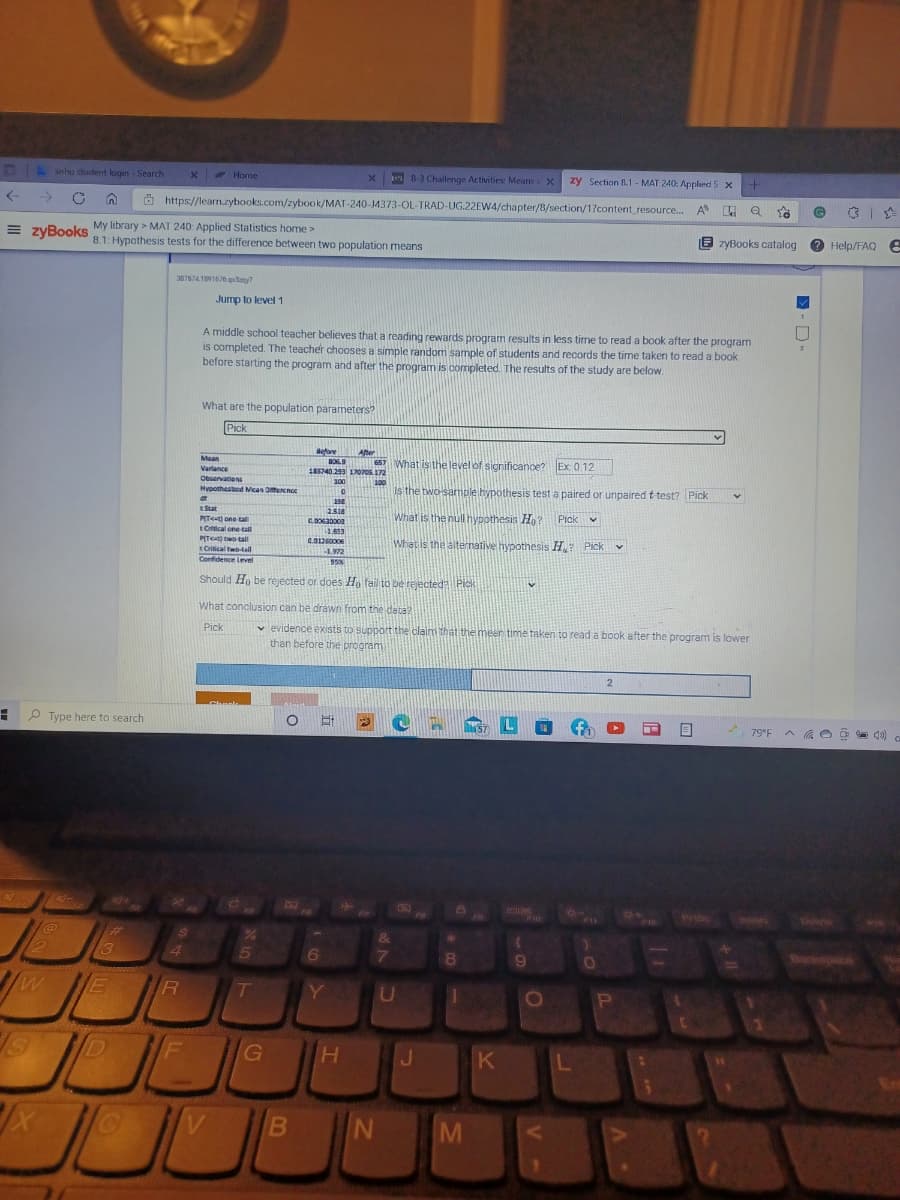
Transcribed Image Text:snhu student login - Search
E Home
B-3 Challenge Activities: Means X
zy Section B.1 - MAT 240: Applind S x
->
O https://learn.zybooks.com/zybook/MAT-240-J4373-OL-TRAD-UG.22EW4/chapter/B/section/1?content_resource.
My library > MAT 240: Applied Statistics home >
8.1: Hypothesis tests for the difference between two population means
= zyBookS
E zyBooks catalog
2 Help/FAQ e
3876741891676 qny7
Jump to level 1
A middle school teacher believes that a reading rewards program results in less tirme to read a book after the program
is completed. The teacher chooses a simple random sample of students and records the time taken to read a book
before starting the program and after the program is completed. The results of the study are below.
What are the population parameters?
Pick
Before
BOS.9
IR1740.299 17070s172
After
657 What isithe level of significance? Ex 0.12
Mean
Varlance
Obsarvations
100
100
Hypothestcd Mcan Ofencnoe
Is the two-sample hypothesis test a paired or unpaired t test? Pick
tStat
2318
What is the null hypothesis Ho?
Pick v
PIT<t) one tall
C.63000
tOftical one tail
PIT two tall
tCritical twotail
Confidence Level
1.553
C.0126000
What is the aiternative hypothesis H? Pick
3.972
95%
Should Ho be rejected or does Hn fail to be rejected?Pick
What conclusion can be dráwn from the data?
v evidence exists to support the claim That the meen time taken to read a book after the program is lower
than before the program
Pick
! P Type here to search
l57
79°F
F10
Prisc
Inrt
Dele
%23
&
2
13
4.
6
7
R
T
D
G
V
M
B
Expert Solution
This question has been solved!
Explore an expertly crafted, step-by-step solution for a thorough understanding of key concepts.

This is a popular solution!

Trending now
This is a popular solution!

Step by step
Solved in 2 steps with 2 images

Recommended textbooks for you
Algebra & Trigonometry with Analytic Geometry
Algebra
ISBN:
9781133382119
Author:
Swokowski
Publisher:
Cengage
Algebra & Trigonometry with Analytic Geometry
Algebra
ISBN:
9781133382119
Author:
Swokowski
Publisher:
Cengage