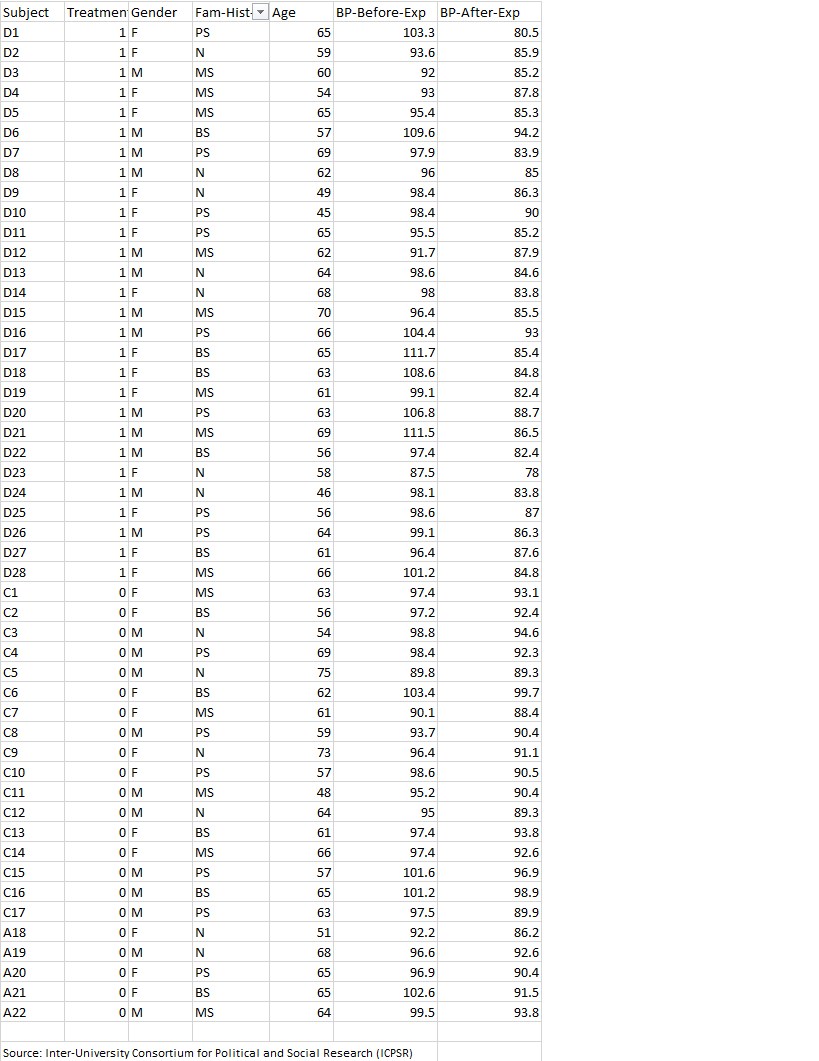
The data in the attached image represents blood pressure based on a new trial medication used in an experiment involving a total of 50 male and female subjects. There were two levels of treatment: 0 = placebo and 1 = treatment group. Family History Blood Pressure = Fam-Hist-BP; from the paternal side = PS; from the maternal side = MS; from both sides = BS; none on both sides or not known = N.; Blood pressure before the experiment = BP-Before-Exp; Blood pressure after the experiment = BP-After-Exp. Task: Construct a scatterplot to display the relationship and find the correlation between BP-Before-Exp and BP-After-Exp.
The data in the attached image represents blood pressure based on a new trial medication used in an experiment involving a total of 50 male and female subjects. There were two levels of treatment: 0 = placebo and 1 = treatment group. Family History Blood Pressure = Fam-Hist-BP; from the paternal side = PS; from the maternal side = MS; from both sides = BS; none on both sides or not known = N.; Blood pressure before the experiment = BP-Before-Exp; Blood pressure after the experiment = BP-After-Exp. Task: Construct a scatterplot to display the relationship and find the correlation between BP-Before-Exp and BP-After-Exp.

MATLAB: An Introduction with Applications
6th Edition
ISBN:9781119256830
Author:Amos Gilat
Publisher:Amos Gilat
Chapter1: Starting With Matlab
Section: Chapter Questions
Problem 1P

Related questions
Topic Video
Question
The data in the attached image represents blood pressure based on a new trial medication used in an experiment involving a total of 50 male and female subjects. There were two levels of treatment: 0 = placebo and 1 = treatment group. Family History Blood Pressure = Fam-Hist-BP; from the paternal side = PS; from the maternal side = MS; from both sides = BS; none on both sides or not known = N.; Blood pressure before the experiment = BP-Before-Exp; Blood pressure after the experiment = BP-After-Exp.
Task: Construct a
Transcribed Image Text:Subject Treatmen Gender
Fam-Hist Age
BP-Before-Exp BP-After-Exp
D1
1 F
PS
65
103.3
80.5
1 F
1 M
D2
N
59
93.6
85.9
D3
MS
60
92
85.2
D4
1 F
MS
54
93
87.8
1 F
1 M
D5
MS
65
95.4
85.3
D6
BS
57
109.6
94.2
D7
1 M
PS
69
97.9
83.9
1 M
1 F
1 F
D8
N
62
96
85
D9
N
49
98.4
86.3
D10
PS
45
98.4
90
D11
1 F
PS
65
95.5
85.2
D12
1 M
MS
62
91.7
87.9
D13
1 M
N
64
98.6
84.6
1 F
1 M
D14
N
68
98
83.8
D15
MS
70
96.4
85.5
D16
1 M
PS
66
104.4
93
D17
1 F
BS
65
111.7
85.4
1 F
1 F
D18
BS
63
108.6
84.8
D19
MS
61
99.1
82.4
D20
1 M
PS
63
106.8
88.7
D21
1 M
MS
69
111.5
86.5
D22
1 M
BS
56
97.4
82.4
D23
1 F
58
87.5
78
D24
1 M
N
46
98.1
83.8
D25
1 F
PS
56
98.6
87
D26
1 M
PS
64
99.1
86.3
D27
1 F
BS
61
96.4
87.6
D28
1 F
MS
66
101.2
84.8
C1
OF
MS
63
97.4
93.1
C2
OF
BS
56
97.2
92.4
C3
O M
54
98.8
94.6
C4
O M
PS
69
98.4
92.3
C5
O M
N
75
89.8
89.3
Сб
O F
BS
62
103.4
99.7
C7
OF
MS
61
90.1
88.4
C8
O M
PS
59
93.7
90.4
C9
OF
N
73
96.4
91.1
C10
OF
PS
57
98.6
90.5
C11
O M
MS
48
95.2
90.4
C12
O M
N
64
95
89.3
C13
OF
BS
61
97.4
93.8
C14
OF
MS
66
97.4
92.6
C15
O M
PS
57
101.6
96.9
C16
O M
BS
65
101.2
98.9
C17
O M
PS
63
97.5
89.9
A18
O F
N
51
92.2
86.2
A19
OM
N
68
96.6
92.6
A20
O F
PS
65
96.9
90.4
A21
OF
BS
65
102.6
91.5
A22
O M
MS
64
99.5
93.8
Source: Inter-University Consortium for Political and Social Research (ICPSR)
Expert Solution
This question has been solved!
Explore an expertly crafted, step-by-step solution for a thorough understanding of key concepts.

Step by step
Solved in 3 steps with 3 images

Knowledge Booster


Learn more about
Need a deep-dive on the concept behind this application? Look no further. Learn more about this topic, statistics and related others by exploring similar questions and additional content below.Recommended textbooks for you
MATLAB: An Introduction with Applications
Statistics
ISBN:
9781119256830
Author:
Amos Gilat
Publisher:
John Wiley & Sons Inc

Probability and Statistics for Engineering and th…
Statistics
ISBN:
9781305251809
Author:
Jay L. Devore
Publisher:
Cengage Learning

Statistics for The Behavioral Sciences (MindTap C…
Statistics
ISBN:
9781305504912
Author:
Frederick J Gravetter, Larry B. Wallnau
Publisher:
Cengage Learning
MATLAB: An Introduction with Applications
Statistics
ISBN:
9781119256830
Author:
Amos Gilat
Publisher:
John Wiley & Sons Inc
Probability and Statistics for Engineering and th…
Statistics
ISBN:
9781305251809
Author:
Jay L. Devore
Publisher:
Cengage Learning
Statistics for The Behavioral Sciences (MindTap C…
Statistics
ISBN:
9781305504912
Author:
Frederick J Gravetter, Larry B. Wallnau
Publisher:
Cengage Learning

Elementary Statistics: Picturing the World (7th E…
Statistics
ISBN:
9780134683416
Author:
Ron Larson, Betsy Farber
Publisher:
PEARSON

The Basic Practice of Statistics
Statistics
ISBN:
9781319042578
Author:
David S. Moore, William I. Notz, Michael A. Fligner
Publisher:
W. H. Freeman

Introduction to the Practice of Statistics
Statistics
ISBN:
9781319013387
Author:
David S. Moore, George P. McCabe, Bruce A. Craig
Publisher:
W. H. Freeman