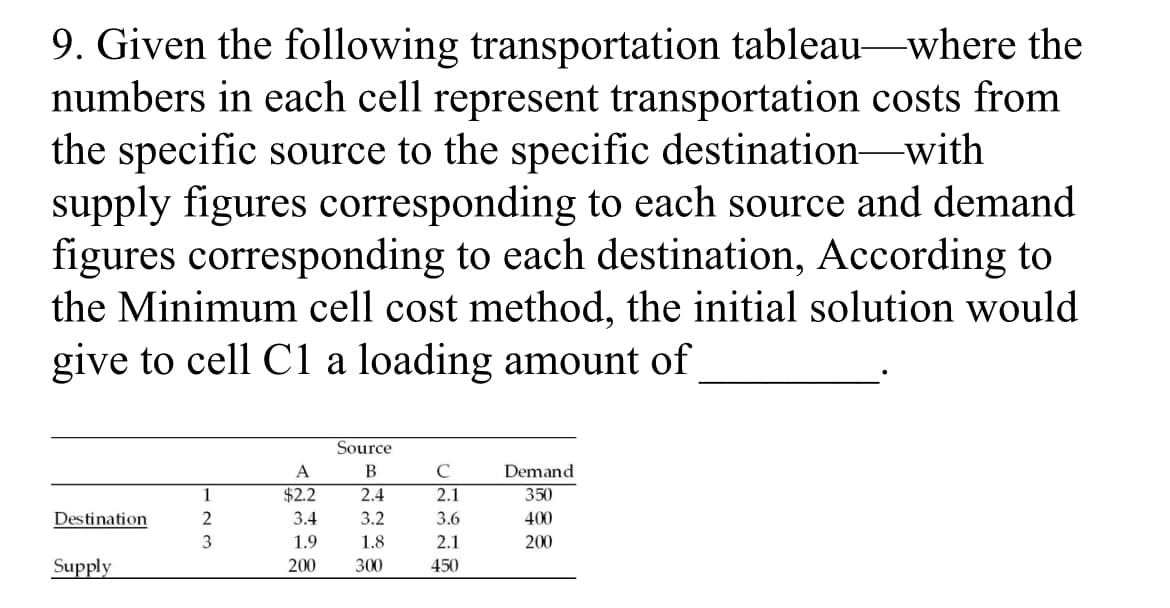
Source A B C Demand 1 $2.2 2.4 2.1 350 Destination 2 3.4 3.2 3.6 400 1.9 1.8 2.1 200 Supply 200 300 450


Q: Price (RM) per kg Harga (RM) per kg Price index in the year 2017 based on the year 2015 | Weightage…
A: A price index is a weighted average of the prices of a selected basket of goods and services…
Q: 5(a) What shall be the demand if price is set to be Rs.75/ linear regress model. S.No. Price…
A: Given the data Price (Rs/kg) Demand (kg) 62 280 68 310 78 350 89 370 85 360 53 250…
Q: А в с D Сарacity F1 12 18 6 25 200 F2 8 7 7 10 18 500 F3 14 3 11 20 300 Demand 180 320 100 400
A:
Q: The table below contains price-demand and total cost data for the production of treadmills, where p…
A: Given Data : X Y = P($) 2910 1450 3415 1275 4645 1123 5330 918 Now, for calculating…
Q: You are given the following information about items X, Y, and Z. Unit Price $ Item 2010 2015…
A: The information provided is given below:
Q: Charlie has a Chocnut factory with production plants at locations A, B and factory capacities are…
A: Given, Factory D E F Capacity A 16 20 12 200 B 14 8 18 160 C 26 24 16 90 Demand 180…
Q: 5. Below is a transportation table, Use the VAM method, what is the total cost ? To From 1 4 Supply…
A: Maximum penalty 200, which occurs in row B Minimum Cij in row is C23=400 Maximum allocation in cell…
Q: product will create a demand for it among department store buyers. The following table shows the…
A: Comment: As per the our company guidelines we are supposed to answer only three subparts. Kindly…
Q: An investment club has set a goal of earning 15% on the money it invests in stocks. The members are…
A: Consider the given data.
Q: Demand p($/unit) 182 167 153 | 143 133 | 125 | 118 9 (quantity) 5 10| 15| 20 25 30 | 35 Supply…
A:
Q: One of the tables below represents a supply curve; the other represents a demand curve. Table 1 p…
A:
Q: 6. The table shows the estimated yearly costs to attend Blinn College. What are the estimated total…
A: To find the total cost we just need to add all the costs.
Q: Optimal Through Put for each Crude Delivered price per gallon (pesos) Crude Regular gasoline…
A: The following steps are used to find the solution of the linear programming problem by simplex…
Q: Exercise 3.1 The orders from n= 100 customers for wooden panels of various thickness (X) are…
A: The table for the wooden panel of various thickness is, Wooden panel thickness 18''…
Q: parts (a) and (b) below the number of accidents, fatalities, hours flown, and miles flown for a…
A: Given that Number of accidents in 2002=44 & Hours Flown =16.1 Number of accidents in 2012=25…
Q: Find the consumer surplus and producer surplus. Demand Supply p = 170 − 0.00003x p = 70…
A: The consumer surplus is given by ∫0xd(p)dx-p×x and producer surplus is given by p×x - ∫0xs(p)dx
Q: XYZ Company, Annual Data Actual Demand. Forecasted Demand 15 14 15…
A: The formula for mean absolute deviation is MAD = (Σ|At – Ft|)/n, where At is the actual value and Ft…
Q: A dry cell battery ianulacturing company has three plants and five sales offices that are located at…
A: Please check the answer given below
Q: Sources Destinations Supply D1 D2 D3 D4 S1 20 10 5 7 10 S2 13 12 8. 20 S3 15 4 7 9. 30 S4 7 14 1 40…
A: Table 1: D1 D2 D3 D4 Supply Row penalty S1 20 10 5 7 10 7-5=2 S2 9 13 12 8 20 9-8=1 S3 15…
Q: Calculate the rank Expenditure 10 for 15 14 25 14 14 22 promotion 12 18 25 40 10 7. 20
A: Promotion (X) Profit (Y) Rank X Rank Y D = X-Y D^2 10 6 1 1 0 0 15 25 5 6.5 -1.5 2.25 14 12 3…
Q: You are given the following information about items A, B, C, and D. Unit Price ($) Item 2010 2015…
A: From the given information, the current price of unit A is 0.92 and the base price of unit A is…
Q: This is the following demand data: Period Demand 1 40 2 55 60 4 35 30 6. 52
A: Given information: The data represents the values of demand for the time periods 1 through 8.
Q: 4. Find the equilibrium point: Demand: p = 480 – 39 Supply: p = 17q + 80
A: To find the equilibrium point Demand: p=480-3q Supply: p=17q+80
Q: The following table gives the calories, fat, and carbohydrates per ounce for three brands of cereal.…
A:
Q: USC' STANDS FOR UNIT SHIPPING COST AREA X AREA Y AREA Z SUPPLIES 300 300 PLANT A 600 USC: 5 USC: 7…
A: Solution: AREA X AREA Y AREA Z SUPPLIES PLANT A 300 USC: 5 300 USC : 7 USC:7 600…
Q: 6. Below is a transportation table, Use the VAM method, what is the loading amount in C2 cell ? To…
A: Find the row difference and column difference. From 1 2 3 4 SUPPLY Row difference A 500 750…
Q: REGION L 2 3 1 = SALES (Y) ('000 gallons) 160 220 140 190 130 ADVERTISING EXPENSES (A) ($'000) 150…
A: i. Dependent variable: SALES (Y) (‘000 gallons) Independent variables: ADVERTISING EXPENSES (A)…
Q: Two different forecasting techniques (F1 and F2) were used to forecast demand for cases of bottled…
A: we need to find MSE and MAPE MSE = Average(dev^2) = 253/8 = 31.62 MAPE = Average((abs…
Q: то A B D Supply From | I 12 4 5 55 II 1 6 6 45 III 1 12 4 7 30 Demand 40 20 40 20
A: The transportation problem is considered as a special type of L.P.P whose adjectives is to determine…
Q: Rental ($) Bedrooms Age Blocks 800 3 15 1300 2 11 1600 2.5 2500 18 2.5 2800 4. 11 2.5 3300 4 10 2.5…
A:
Q: Philips manufacturers multicookers in Woodlands, Pasir Ris, and Toa Payoh. Multicookers must then be…
A:
Q: he average costs for college tuition and their quantities in 2010 and 2020 2010 Cost Quantity Cost…
A: The formula for computing Laspeyer's index is, Here po is the cost of base year and qo is quantity…
Q: Rodding Level Compressive Strength 10 1530 1530 1440 15 1610 1650 1500 20 1560 1730 1530 25 1500…
A:
Q: Sales and SQFT Scatter Plot 10.00 9.00 8.00 7.00 6.00 5.00 4.00 3.00 2.00 1.00 0.00 200 300 100 400…
A: Given two scatter plots and we have to explain what is happening in these two seperate graphs.
Q: Bread Water Plows Metal Quantity Price Quantity Quantity $1 Price Quantity Price Price 2011 $2 100…
A: We need to calculate real value of water in each year to determine in which year it is most…
Q: Department Cumulatve Percent 25.0 742 Frequency Percent 16 valid Percent 229 Development Computer…
A: Bar graph: A bar graph can be defined as a chart or a graphical representation of data.
Q: 1.Income on Housing = 28% 2.Food = 15% 3.Clothing =…
A: Given, 1.Income on Housing = 28% 2.Food = 15% 3.Clothing…
Q: A building has an average winter consumption (AWC) of water of 10,000 gallons/month. During the…
A: a) Average winter monthly cosuption is 10,000 gallons/month. Now, given, Hence the rate per 1000…
Q: Years of Annual Sales Salesperson Experience ($1000s) 1 1 80 89 3 3 99 4 3 118 5 136 7 140 7 152 8…
A: Given : Salesperson Years of experience Annual Sales ($1000s) 1 1 80 2 2 89 3 3 99 4 3…
Q: T 9. 11 12 data 13 14 15 16 7 8 10 Based on the boxplot above, what is the value for the minimum…
A: Solution : A box plot consist of Minimum, first quartile, median, third quartile and maximum.
Q: Shawn is a sales representative receiving an annual salary of ₱120,000 plus commission on all his…
A:
Q: The population and deaths of two towns according to age groups are giyen below: Town A Town B Age…
A:
Q: From the data given below, aggregative expenditure ideal method: Commodity Current Year Base Year…
A: The price of commodities in the base year as well as current year by its corresponding the weight in…
Q: Material Unit Product A Product B Product C Steel Ton 5 4 Aluminum KG 50 40 60 Wood CFT 10 10 Glass…
A: Monthly demand for A , B and C is given . We will calculate the 6 month demand of products and then…
Q: TYLERS SAVING ACCOUNT JORDANS SAVING ACCOUNT Years Money Years Money y 500 525 551.25 578.81 607.75…
A: Consider the table-1: According to the table, it is generating a linear table. The best fit graph is…
Q: n Galt Shipping wishes to ship a product that is made at two different factories to three different…
A: (a) To\from warehouse A warehouse B warehouse C Total Factory A 4…
Q: Statistics Question
A: Hey, since there are multiple subparts posted, we will answer first three question. If you want any…
Q: Average Household Expenditures by Major Category 1950 2010 4.4% 3.3% 6.6% 19.2% 22.0% 2.4% 11.2%…
A: Solution : Given : Average household expenditure by major categories in the years 1950 and 2010.…
Q: 1.The five week demand forecasts are given in the following table: Week Demand 1 4 3 360 220 260 140…
A:

Brief answer

Step by step
Solved in 2 steps with 5 images


- The Megabuck Hospital Corp. is to build a state-subsidized nursing home catering to homeless patients as well as high-income patients. State regulations require that every subsidized nursing home must house a minimum of 750 homeless patients and no more than 900 high-income patients in order to qualify for state subsidies. The overall capacity of the hospital is to be 1,800 patients. The board of directors, under pressure from a neighborhood group, insists that the number of homeless patients should not exceed twice the number of high-income patients. Due to the state subsidy, the hospital will make an average profit of $9,500 per month for every homeless patient it houses, whereas the profit per high-income patient is estimated at $8,000 per month. How many of each type of patient should it house in order to maximize profit? HINT [See Example 3.] (If an answer does not exist, enter DNE.) high-income patients: homeless: profit:The Megabuck Hospital Corp. is to build a state-subsidized nursing home catering to homeless patients as well as high-income patients. State regulations require that every subsidized nursing home must house a minimum of 760 homeless patients and no more than 800 high-income patients in order to qualify for state subsidies. The overall capacity of the hospital is to be 2,100 patients. The board of directors, under pressure from a neighborhood group, insists that the number of homeless patients should not exceed twice the number of high-income patients. Due to the state subsidy, the hospital will make an average profit of $9,800 per month for every homeless patient it houses, whereas the profit per high-income patient is estimated at $7,800 per month. How many of each type of patient should it house in order to maximize profit? (If an answer does not exist, enter DNE.) high-income patients homeless patients profitThe Megabuck Hospital Corp. is to build a state-subsidized nursing home catering to homeless patients as well as high-income patients. State regulations require that every subsidized nursing home must house a minimum of 700 homeless patients and no more than 620 high-income patients in order to qualify for state subsidies. The overall capacity of the hospital is to be 1,800 patients. The board of directors, under pressure from a neighborhood group, insists that the number of homeless patients should not exceed twice the number of high-income patients. Due to the state subsidy, the hospital will make an average profit of $13,000 per month for every homeless patient it houses, whereas the profit per high-income patient is estimated at $9,000 per month. How many of each type of patient should it house in order to maximize profit? Group of answer choices A)700 homeless patients and 1,100 high-income patients B)1,200 homeless patients and 600 high-income patientsC)700 homeless patients…
- The Megabuck Hospital Corp. is to build a state-subsidized nursing home catering to homeless patients as well as high-income patients. State regulations require that every subsidized nursing home must house a minimum of 700 homeless patients and no more than 620 high-income patients in order to qualify for state subsidies. The overall capacity of the hospital is to be 1,800 patients. The board of directors, under pressure from a neighborhood group, insists that the number of homeless patients should not exceed twice the number of high-income patients. Due to the state subsidy, the hospital will make an average profit of $13,000 per month for every homeless patient it houses, whereas the profit per high-income patient is estimated at $9,000 per month. How many of each type of patient should it house in order to maximize profit?Federated Electronics, Ltd., manufactures display screensand monitors for computers and televisions, which it sellsto companies around the world. It wants to construct a new warehouse and distribution center in Asia to serve emerg-ing markets there. It has identified potential sites in the port cities of Shanghai, Singapore, Pusan, Kaohsiung, and HongKong and has estimated the possible revenues for each(minus construction costs which are higher in some citieslike Hong Kong). At each site the projected revenues are primarily based on these factors, (1) the economic condi-tions at the port including the projected traffic, infrastruc-ture, labor rates and availability; and expansion and modernization; and (2) the future government situationwhich includes the political stability, fees, tariffs, duties,and trade regulations. Following is a payoff table thatshows the projected revenues (in $ billions) for six years given the four possible combinations for positive and nega-tive port and…A bus system needs to be set up from Village of Westmont to Hinsdale (2.5 miles), then continues to Berwyn (8.5 miles), and finally terminates its run to Cicero (1 mile). The operating time is 55 minutes, the policy headway is 30 minutes, and the minimum terminal time is 19 minutes (including 6 minutes terminal time at each location of Clarendon Hills and Berwyn, and 7 minutes at Cicero). It has been established that the peak-hour demand is 500 passengers per hour and 50-seater buses are available, which can safely accommodate 25 standees. Assume the load factor is 0.8. Design the bus system
- The government of Grenada wishes to rebuild the West coast road that leads to the north of the island to help alleviate traffic congestion and to provide users with a safer road network. The government of Grenada has approached two (2) contractors for an estimate. They are required to submit a proposal that details the cost combination of labour (L), machinery (M), and technology (T) in achieving their expected total cost, total profit, and total revenue. Contractor 1 Two labour, four machinery, and three technology will result in a total cost of thirty-three dollars. While one labour, two machinery, and one technology give a total profit of fifteen dollars. Lastly, ten labour, five machinery, and six technologies result in total revenue of eighty-three dollars. Contractor 2 No Proposal was submitted. a) From Contractor I's proposal, derive three (3) simultaneous equations. b) From the answer to part a) above, set these equations in matrix form c) Given that the government of Grenada…The government of Grenada wishes to rebuild the West coast road that leads to the north of the island to help alleviate traffic congestion and to provide users with a safer road network. The government of Grenada has approached two (2) contractors for an estimate. They are required to submit a proposal that details the cost combination of labour (L), machinery (M), and technology (T) in achieving their expected total cost, total profit, and total revenue. Contractor 1 Two labour, four machinery, and three technology will result in a total cost of thirty-three dollars. While one labour, two machinery, and one technology give a total profit of fifteen dollars. Lastly, ten labour, five machinery, and six technologies result in total revenue of eighty-three dollars. Contractor 2 No Proposal was submitted. From Contractor 1’s proposal, derive three (3) simultaneous equations. b) From the answer to part a) above, set these equations in matrix form c) Given that the government of Grenada…A Leading manufacturer of Action Figures is about to introduce four new Action Figures. The accompanying table summarizes price and cost data, combined fixed costs equal $650,000. A marketing research study predicts that for each unit sold of Noyan, 2 units of Dogan, 3 units of Bamsi and 4 units of Turgut will be sold. Action Figures Turgut Bamsi Dogan Noyan Selling Price (in dollars) 35 26 24 16 Variable Cost/unit (in dollars) 17 12 12 11 Table 1 How many product mix units must be sold to break even? How does it translate into sales of individual games?
- J. D. Williams, Inc. is an investment advisory firm that manages more than $120 million in funds for its numerous clients. The company uses an asset allocation model that rec- ommends the portion of each client’s portfolio to be invested in a growth stock fund, an income fund, and a money market fund. To maintain diversity in each client’s portfolio, the firm places limits on the percentage of each portfolio that may be invested in each of the three funds. General guidelines indicate that the amount invested in the growth fund must be between 20% and 40% of the total portfolio value. Similar percentages for the other two funds stipulate that between 20% and 50% of the total portfolio value must be in the income fund and that at least 30% of the total portfolio value must be in the money market fund. In addition, the company attempts to assess the risk tolerance of each client and adjust the portfolio to meet the needs of the individual investor. For example, Williams just con- tracted…Cecille Paper Company uses softwood and hardwood pulp as basic materials for producing converter-grade paper. Hardwood is 80% pulp fiber and 20% pulp binder, while softwood is 50% pulp fiber and 50% pulp binder. The cost per pound for hardwood and softwood is $.50 and $.40, respectively. The company s quality control expert specifies that in order for the product to meet quality standards, each batch must contain at least 12,000 pounds of pulp fiber and at least 6,000 pounds of pulp binder. Because of equipment limitations, the size of a batch cannot exceed 24,000 pounds. The Production Department recently received a new standard from the Cost Department, allowing $8,200 per batch. The production manager feels that this amount is too low, because such costs have never been less than $8,400. Required: Using the graphic method, determine the hardwood and softwood mix necessary to minimize the cost per batch.In the Erlang loss model, system A has 5 servers and an implied utilization of 125 percent,while system B has 15 servers and an implied utilization of 125 percent. Which of thefollowing statements is true?a. System A has the higher utilization because it has fewer servers relative to the potentialdemand.b. The two systems have the same utilization because they have the same implied utilization.c. System B has a higher utilization because the fraction of lost demand is lower in that system.d. More information is needed to determine which system has the higher utilization.


