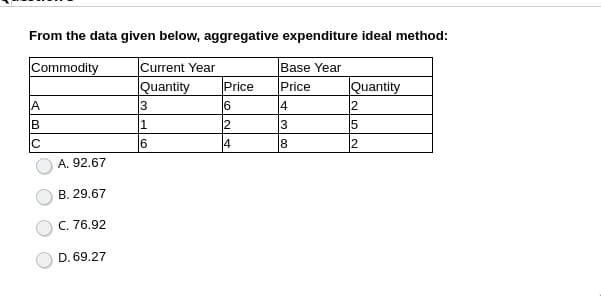
From the data given below, aggregative expenditure ideal method: Commodity Current Year Base Year Quantity Price Price Quantity A. 4 B 2 3 4 8 A. 92.67 B. 29.67 C. 76.92 D. 69.27 252 316


Q: b) The price and monthly quantities of five materials purchased by a manufacturer in the years 2020…
A: The price and monthly quantities of five materials purchased by a manufacturer is in the following…
Q: For the year data given in the chart find a power function that is used to model the Lorenz…
A: A power function is of the form,y = axbWe can take log to the natural base “e” on the both the sides…
Q: Google has changed its strategy with regard to how much and over which media it invests in…
A: Introduction: We have used Excel to draw the side-by-side bar chart.
Q: Determine the mistakes in the given graphs below. Project Cost Breakdown Sales Labor 200 17.48%…
A: Graphical literacy plays an important role in interpreting it. Decorating for pleasing and dragging…
Q: 5. An enquiry into budgets of the middle class families in a city gave the following information :…
A:
Q: From the following data relating to the annual wages and the price indi; determine by deflation :…
A:
Q: Apply the 3-years moving average method to forecast the required demand for the year 2021 from the…
A: Solution : Given data is Years 2012 2013 2014 2015 2016 2017 2018 2019 2020 Demand 245 325 300…
Q: The table shows the estimated yearly costs to attend Texas A&M University. What is the estimated…
A: We have to find the estimated total cost to attend the first year.
Q: 7. Calculate the weighted price index from the following data : Quantity required Price during 2014…
A:
Q: From the following data, compute i. Laspeyre’s price index ii. Paasche’s price index Commodity…
A: Commodity Base Commodity Base Current period Current period Price (K) Quantity (Kg) Price (K)…
Q: Populate the table American Net Barrel Oil ($) Year Income ($ ху y (x) million) (y) 2005 56 -850…
A: ( Please note that ∑x2=28015 ) The data for American's net income and price of oil is listed…
Q: Table: Data of House Value versus Rental Value Rental Value Rental Value Rental Value…
A: Given data, Value Rental 81000 6656 95000 7904 121000 12064 135000 8320 145000 8320…
Q: The following data table relates to the supply schedule of a product. Quantity Supplied (Units Per…
A: Over the price range $25 to $30. The change in quantity = 350-500350+500…
Q: TABLE 1.3 Per capita total expenditure on health (international dollars) Dollars Country Dollars…
A: Introduction: We need to obtain the stemplot for the data.
Q: 2. What features Bad Presentation Good Presentation of the 'Good Minimum Wage Minimum Wage 1.00…
A: Given: Two Bad and Good Presentation
Q: Optimal Through Put for each Crude Delivered price per gallon (pesos) Crude Regular gasoline…
A: The following steps are used to find the solution of the linear programming problem by simplex…
Q: Mean Shipping Cost per Unit ($) Base-Period Quantities (Year 1) Products Year 1 Year 5 A 2,500 10.50…
A:
Q: Your monthly expenditure on beauty and salon services (skin, hair, and nail-care services and…
A: Data visualization is the process of denoting the numerical data visually. Data visualization can be…
Q: 12. Given the following information. Material Required Unit Quantity Required Price (Rs.) 2000 2002…
A:
Q: Café Michigan's manager, Gary Stark, suspects that demand for mocha latte coffees depends on the…
A: Regression:In order to obtain the least square regression line, first perform regression analysis on…
Q: From the following data find out (i) purchasing power of money, (ii) real income, and (iii) real…
A:
Q: Calculate Price Index using Fisher's Method and Bowley's formula: Current year Base year Quantity…
A:
Q: XYZ Company, Annual Data Actual Demand. Forecasted Demand 15 14 15…
A: The formula for mean absolute deviation is MAD = (Σ|At – Ft|)/n, where At is the actual value and Ft…
Q: Total cost and number of units in the first seven months of 2020 are given below. According to this…
A: a. Y=16000+52*X
Q: For the period 1970-1991 for the United States the following two rival consumption models were…
A: The model with the lowest AIC value being considered the ‘best’. From the provided information, the…
Q: A coastal community needs to know the sustainable yield of grouper for its upcoming fishing season.…
A: To find : How many adult groupers can be sustainably caught during the fishing season in year 3. (a)…
Q: (c) Table 1 shows the daily income of fruit sellers. 100 120 120 110 200 180 170 160 145 120 Table…
A: Given data, 100 120 120 110 200 180 170 160 145 120 Arrange the data in the ascending order 100 110…
Q: DATA 3. (18 breeds of dogs, body weight of each dog (in pounds), and the amount of food consumed in…
A: Given,
Q: For the period 1970-1991 for the United States the following two rival consumption models were…
A: a) The model with the lowest AIC value being considered the ‘best’. From the provided information,…
Q: 6. A mobile phone company offers a phone plan that allows 600 min of airtime per month. The revenue…
A:
Q: 1. Use the data given to solve the following problems. Savings needed for Health-Care Expenses…
A: Given data: Age at Death Savings Needed 80 $219,000 85 $307,000 90 $409,000 95…
Q: City Density (people per km²) Population Land Area (km²) New York 8 550 405 783.8 Shanghai 24 256…
A:
Q: Given the following data : 1996 1997 1998 Year : Weekly take home Pay (Rs.): Consumer Price index :…
A:
Q: The table below gives data on daily food expenditure ($) for males and females in the year 2020.…
A: From the given information, Y is the food expenditure and D as gender. Y D 25 1 38 1 43 1…
Q: From the data given below find the cost of living index number for 1998. Per cent of total Items…
A:
Q: Miami Central som:. 16. 15. (3500, 460), 1000 450 (3,860 900 400 800 350 (5) 700 * 300 (1000, 310)…
A: In this question we will use basic of algebra i.e equation of straight line when two points are…
Q: Table 3.4 Price Behaviour of an Equity Share 'A' (in Rupees) Months Highest Price Lowest Price…
A:
Q: ample 20. Calculate price index number for the year 1996 with 1986 as the base year from the…
A: Answer: Formulas: Laspeyre's price index number, PL01=∑p1q0∑p0q0×100 Paasche's price index number,…
Q: Below is a line graph of the storage capacities measured in MegaLitres (ML), from the supplier dams…
A:
Q: Which of the following scenarios are either not accounted for or measured inaccurately by either the…
A: Valid options are: b) The value of babysitting services, when the babysitter is paid in cash and…
Q: A group of researchers carried out a survey of household expenditure for an average family and the…
A: “Since you have posted a question with multiple sub-parts, we will solve first three sub-parts for…
Q: Annual revenue (in million dollars) earned by the CrazyNet are provided below. Year 2001 2002 2003…
A: Hello! As you have posted more than 3 sub parts, we are answering the first 3 sub-parts. In case…
Q: Using the following national income accounting data, compute (a) GDP, (b) NDP, and (c) NI. All…
A:
Q: 47. Given the following data : Weekly take-home pay (wages) Consumer price index Year 109.50 112.8…
A:
Q: 2018 2020 Items Price (Kshs/Kg) Quantity (Kg,000) Price (Kshs/Kg) Quantity (Kg,000)…
A:
Q: Average Household Expenditures by Major Category 1950 2010 4.4% 3.3% 6.6% 19.2% 22.0% 2.4% 11.2%…
A: Solution : Given : Average household expenditure by major categories in the years 1950 and 2010.…
Q: 7. Calculate the weighted price index from the following data : Quantity required Price during 1995…
A: The weighted price index is Laspeyre's Price Index.
Q: Given the Information in the below table's, calculate the total cost if you choose the: i) Level…
A: we are given a table and we ned to find total cost using different categories
Q: Table 5.1. Computing a grade point average [R149] Grade Equivalent Quality Grade Point Credits Point…
A: GPA on a 4.0 scale A = 4.0, A- = 3.7, B+ = 3.3, B = 3.0, B- = 2.7, C+ = 2.3, C = 2.0, C- = 1.7, D+ =…

Step by step
Solved in 2 steps

- Construct index number of price from the following data byapplying: Bowley’s method 2016 2016 2017 2017 Commodity Price Quantty Price QuanttyA 2 8 4 6B 5 10 6 5C 4 14 5 10D 2 19 2 13The data below have been taken from the cost records of the Halifax General Hospital. The data relate to the costs of admitting patients at various levels of patient activity: Month Number of Patients Admitting Admitted Department CostsMay..................................................................... 3,600 $ 29,400June .................................................................... 3,800 $ 28,700July ...................................................................... 2,900 $ 27,400August ................................................................ 3,200 $ 28,000September .......................................................... 3,300…In the packaging department of a large aircraft parts distributor, a fairly reliable estimate ofpackaging and processing costs can be determined by knowing the weight of an order. Thus, theweight is a cost driver that accounts for a sizable fraction of the packaging and processing costsat this company. Data for the past 10 orders are given as follows:
- When wildebeest are more abundant, they graze the grass more heavily, so there are fewer fires and moretrees grow. Lions feed more successfully when there are more trees, so the lion population increases. Thedata on one part of this cycle, wildebeest abundance (in thousands of animals) and the percent of the grassarea that burned in the same year are on the spreadsheet. To what extent do these data support the claim that more wildebeest reduce the percent of grasslands that burn? How rapidly does burned area decrease as the number of wildebeest increases? To answer these questions, create a scatterplot and add the regression line. Describe the scatterplot. Interpret the slope and intercept in context of the problem. Does the intercept explanation make sense in the real world? Find the correlation coefficient and coefficient of determination. What do they tell us about the relationship between number of wildebeest and percent of grassland burned? Beest (in 1000s) Percent Burned…In a particularly small region in the Philippines, the consumer price index C depends onWhen the moving average method is used to estimate the seasonal factors with quarterly sales data, a ______ period moving average is used.
- Clonex Labs, Incorporated, uses the weighted-average method in its process costing system. The following data are available for one department for October: Units Percent Completed Materials Conversion Work in process, October 1 46,000 85% 65% Work in process, October 31 32,000 67% 54% The department started 391,000 units into production during the month and transferred 405,000 completed units to the next department. Required: Compute the equivalent units of production for October. Equivalent units of production: Material - Conversion -2. Given the data, test whether there is a relationship between the number of years in college (X) of thestudents and their subsequent yearly income at 5% level of significance.Construct index number of price from the following data byapplying: Marshall-Edgeworth’s methodand comment on the results. Commodity Price Quantty Price QuanttyA 2 8 4 6B 5 10 6 5C 4 14 5 10D 2 19 2 13
- Consider the following data:Monthly Profit of an Auto Repair Shop Month Jan-14 Feb-14 Mar-14 Apr-14 May-14 Jun-14 Jul-14 Aug-14 Sep-14 Profit ($) 15,70915,709 15,85915,859 14,65514,655 16,71316,713 18,36318,363 17,17017,170 19,14519,145 18,42418,424 20,20620,206 Step 1 of 4 : Determine the three-period moving average for the next time period. If necessary, round your answer to one decimal place.Consider the following data:Monthly Profit of an Auto Repair Shop Month Jan-14 Feb-14 Mar-14 Apr-14 May-14 Jun-14 Jul-14 Aug-14 Sep-14 Profit ($) 17,93117,931 18,08118,081 16,85516,855 19,04619,046 20,56320,563 17,39017,390 19,12319,123 18,66618,666 20,47020,470 Step 2 of 4: Determine the three-period weighted moving average for the next time period with weights of 33 (most recent), 22 (second latest time period), and 11 (oldest time period). If necessary, round your answer to one decimal place.Nas corporation's manager in the stamping department have been studying the overhead cost and the relatioship machine hours. Data from the most recent 12 months Month Overhead Machine hours January 5,030 2,730 February 1,600 600 March 7,210 3,403 April 4,560 2,200 May 6,880 3,411 June 6,520 2,586 July 6,230 3,364 August 5,570 2,411…
