South Salinas Price Sq Feet Beds 3 2 549 415 565 1175 600 506 489 590 419 500 969 750 399 650 439 609 620 320 630 432 600 425 612 675 1512 1023 2436 3559 2093 1531 1132 1577 1536 1630 2845 2661 895 1951 971 2043 1848 766 2130 1400 2600 1556 2105 2003 4 5 4 3 3 3 3 3 4 4 2 3 4 4 3 2 4 3 5 3 4 3 North Salinas Price Sq Feet Beds 535 4 389 2 229 459 440 285 439 495 295 347 549 599 500 382 379 475 419 529 489 504 540 550 549 379 2473 1118 932 1240 1387 720 1569 1928 1205 948 1861 2591 1443 1215 1034 1215 1102 1877 1308 1701 1427 2602 1823 936 2 3 3 2 3 3 2 2 3 4 3 3 2 3 3 4 3 4 3 542 2
South Salinas Price Sq Feet Beds 3 2 549 415 565 1175 600 506 489 590 419 500 969 750 399 650 439 609 620 320 630 432 600 425 612 675 1512 1023 2436 3559 2093 1531 1132 1577 1536 1630 2845 2661 895 1951 971 2043 1848 766 2130 1400 2600 1556 2105 2003 4 5 4 3 3 3 3 3 4 4 2 3 4 4 3 2 4 3 5 3 4 3 North Salinas Price Sq Feet Beds 535 4 389 2 229 459 440 285 439 495 295 347 549 599 500 382 379 475 419 529 489 504 540 550 549 379 2473 1118 932 1240 1387 720 1569 1928 1205 948 1861 2591 1443 1215 1034 1215 1102 1877 1308 1701 1427 2602 1823 936 2 3 3 2 3 3 2 2 3 4 3 3 2 3 3 4 3 4 3 542 2

Chapter9: Sequences, Probability And Counting Theory
Section9.7: Probability
Problem 2SE: What is a sample space?

Related questions
Question
Q4
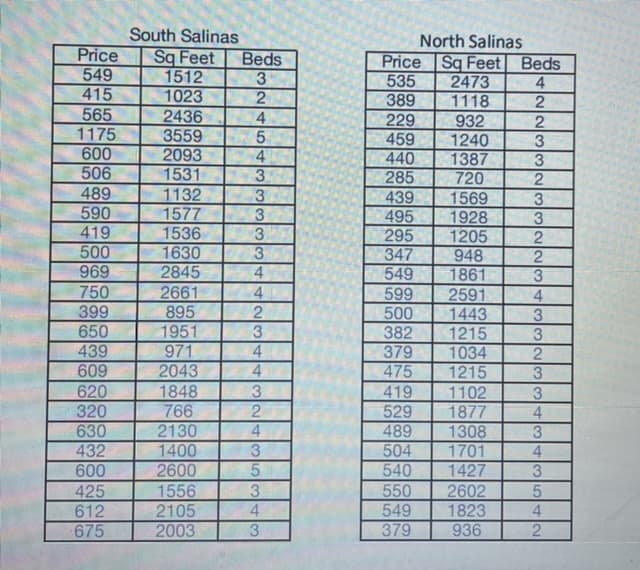
Transcribed Image Text:South Salinas
Price Sq Feet
549
1512
415
1023
565
2436
1175
3559
600
2093
506
1531
1132
1577
1536
1630
2845
2661
895
1951
971
2043
489
590
419
500
969
750
399
650
439
609
620
320
630
432
600
425
612
675
1848
766
2130
1400
2600
1556
2105
2003
Beds
3
2
4
5
4
3
3
3
3
3
4
4
2
3
4
4
3
2
4
3
5
3
4
3
LECE
North Salinas
Price Sq Feet Beds
535
4
389
229
459
440
285
439
495
295 1205
347
948
549
2473
1118
932
1240
550
549
379
1387
720
1569
1928
1861
599
500
382
379
475
419
529
489
504 1701
540
2591
1443
1215
1034
1215
1102
1877
1308
1427
2602
1823
936
လာကြကြကြကြကြကြကြကြ+
2
2
3
3
2
3
3
2
2
3
4
3
3
2
3
3
4
3
4
3
5
4
2

Transcribed Image Text:Test the claim that the mean price of a house is the same in both South and North
Salinas.
Please provide the claim, critical values, test statistic and conclusion.
Expert Solution
This question has been solved!
Explore an expertly crafted, step-by-step solution for a thorough understanding of key concepts.

Step by step
Solved in 4 steps

Recommended textbooks for you

Algebra & Trigonometry with Analytic Geometry
Algebra
ISBN:
9781133382119
Author:
Swokowski
Publisher:
Cengage

Functions and Change: A Modeling Approach to Coll…
Algebra
ISBN:
9781337111348
Author:
Bruce Crauder, Benny Evans, Alan Noell
Publisher:
Cengage Learning
Algebra & Trigonometry with Analytic Geometry
Algebra
ISBN:
9781133382119
Author:
Swokowski
Publisher:
Cengage
Functions and Change: A Modeling Approach to Coll…
Algebra
ISBN:
9781337111348
Author:
Bruce Crauder, Benny Evans, Alan Noell
Publisher:
Cengage Learning