determine if the average travel time of all the university's students differed from 20 minutes. Find the large-sample rejection region for the test of interest to the college when using a level of significance of 0.05. Reject Ho if z < -1.96 or z > 1.96. Reject Ho if z> 1.645. Reject Ho if z < -1.645 or z> 1.645. Reject Ho if z < -1.96.
determine if the average travel time of all the university's students differed from 20 minutes. Find the large-sample rejection region for the test of interest to the college when using a level of significance of 0.05. Reject Ho if z < -1.96 or z > 1.96. Reject Ho if z> 1.645. Reject Ho if z < -1.645 or z> 1.645. Reject Ho if z < -1.96.

Holt Mcdougal Larson Pre-algebra: Student Edition 2012
1st Edition
ISBN:9780547587776
Author:HOLT MCDOUGAL
Publisher:HOLT MCDOUGAL
Chapter11: Data Analysis And Probability
Section11.4: Collecting Data
Problem 5E

Related questions
Question
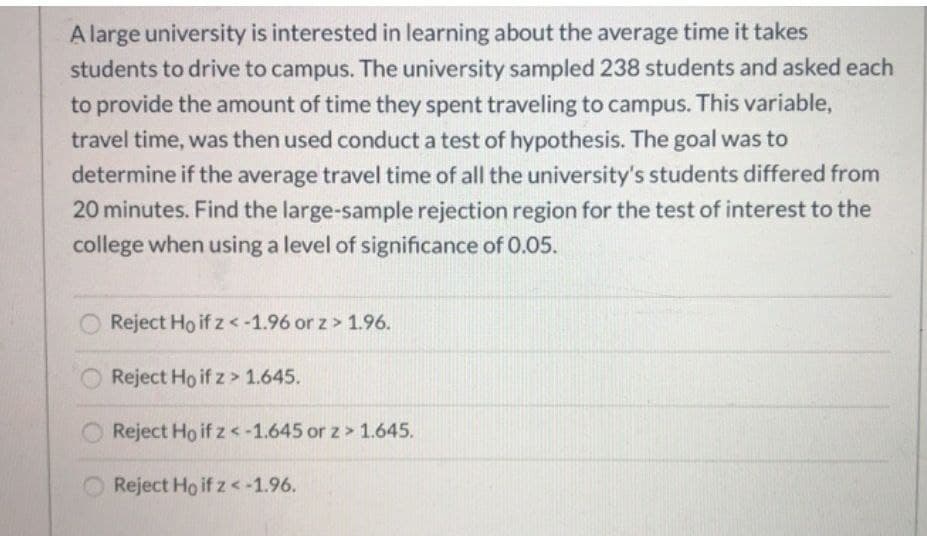
Transcribed Image Text:A large university is interested in learning about the average time it takes
students to drive to campus. The university sampled 238 students and asked each
to provide the amount of time they spent traveling to campus. This variable,
travel time, was then used conduct a test of hypothesis. The goal was to
determine if the average travel time of all the university's students differed from
20 minutes. Find the large-sample rejection region for the test of interest to the
college when using a level of significance of 0.05.
Reject Ho if z < -1.96 or z> 1.96.
Reject Ho if z> 1.645.
Reject Ho if z < -1.645 or z> 1.645.
Reject Ho if z < -1.96.
Expert Solution
This question has been solved!
Explore an expertly crafted, step-by-step solution for a thorough understanding of key concepts.

Step by step
Solved in 2 steps

Recommended textbooks for you
Holt Mcdougal Larson Pre-algebra: Student Edition…
Algebra
ISBN:
9780547587776
Author:
HOLT MCDOUGAL
Publisher:
HOLT MCDOUGAL

Glencoe Algebra 1, Student Edition, 9780079039897…
Algebra
ISBN:
9780079039897
Author:
Carter
Publisher:
McGraw Hill

College Algebra (MindTap Course List)
Algebra
ISBN:
9781305652231
Author:
R. David Gustafson, Jeff Hughes
Publisher:
Cengage Learning
Holt Mcdougal Larson Pre-algebra: Student Edition…
Algebra
ISBN:
9780547587776
Author:
HOLT MCDOUGAL
Publisher:
HOLT MCDOUGAL
Glencoe Algebra 1, Student Edition, 9780079039897…
Algebra
ISBN:
9780079039897
Author:
Carter
Publisher:
McGraw Hill
College Algebra (MindTap Course List)
Algebra
ISBN:
9781305652231
Author:
R. David Gustafson, Jeff Hughes
Publisher:
Cengage Learning