Stargel Inc. Comparative Income Statement For the Years Ended December 31, 20Y2 and 20Y1 20Y2 20Y1 Sales. .. $10,000,000 $9,400,000 Cost of goods sold. Gross profit..... Selling expenses Administrative expenses. Total operating expenses Income from operations. Other income.. 5,350,000 $ 4,650,000 $ 2,000,000 4,950,000 $4450,000 $1,880,000 1,500,000 $ 3,500,000 $ 1,150,000 1,410,000 $3.290,000 $1,160,000 .... .......... 150,000 $ 1,300,000 ..... 140,000 ....... $1,300,000 Other expense (interest).. Income before income tax Income tax expense.. Net income ... 170,000 $ 1,130,000 230.000 $ 900,000 150,000 $1,150,000 225.000 5 925.000 Stargel Inc. Comparative Balance Sheet December 31, 20Y2 and 20Y1 20Y2 20Y1 Assets Current assets: $ s0,000 $ 400,000 1,010,000 Cash. Marketable securities. 1,000.000 Accounts receivable (net). S10,000 950,000 740,000 .... ........... ..... Inventories ....... 1,190,000 ....... ....... Prepaid expenses 250,000 229.000 ........ Total current assets.. $3,690,000 $3,089,000 ........ .......... Long-term investments.... Property, plant, and equipment (net) Total assets. 2,350,000 2,300,000 ..... 3,740,000 3.366.000 $9,780,000 $8,755.000 Liabilities Current liabilities.. Long-term liabilities: $ 900,000 $ 80.000 $ 200,000 S Mortgage note payable, 10%. Bonds payable, 10%... 1,500,000 $1,700,000 $2.600,000 $2.380.000 1,500.000 $1,500.000 ..... Total long-term liabilities Total liabilities. .. Stockholders' Equity Preferred $0.90 stock, $10 par Common stock, $5 par.... Retained earnings.... Total stockholders' equity.... Total liabilities and stockholders'equity. $ 500,000 $ so0,000 s00,000 500,000 6,180,000 $7.180,000 56.375,000 $9.780,000 58.755.000 5375.000 Stargel Inc. Comparative Retained Earnings Statement For the Years Ended December 31, 20Y2 and 20Y1 20Y2 20Y1 $5,375,000 Retained earnings, January 1. Net income.. Total .. Dividends: On preferred stock On common stock... Total dividends.. Retained earnings, December 31 $4,545,000 925,000 $5,470,000 900,000 $6,275,000 $ 45,000 50,000 $ 95,000 $6,180,000 $ 45,000 .. 50,000 $ 95,000 $5,375,000 Instructions Determine the following measures for 20Y2, rounding to one decimal place including percentages, except for per-share amounts:
Stargel Inc. Comparative Income Statement For the Years Ended December 31, 20Y2 and 20Y1 20Y2 20Y1 Sales. .. $10,000,000 $9,400,000 Cost of goods sold. Gross profit..... Selling expenses Administrative expenses. Total operating expenses Income from operations. Other income.. 5,350,000 $ 4,650,000 $ 2,000,000 4,950,000 $4450,000 $1,880,000 1,500,000 $ 3,500,000 $ 1,150,000 1,410,000 $3.290,000 $1,160,000 .... .......... 150,000 $ 1,300,000 ..... 140,000 ....... $1,300,000 Other expense (interest).. Income before income tax Income tax expense.. Net income ... 170,000 $ 1,130,000 230.000 $ 900,000 150,000 $1,150,000 225.000 5 925.000 Stargel Inc. Comparative Balance Sheet December 31, 20Y2 and 20Y1 20Y2 20Y1 Assets Current assets: $ s0,000 $ 400,000 1,010,000 Cash. Marketable securities. 1,000.000 Accounts receivable (net). S10,000 950,000 740,000 .... ........... ..... Inventories ....... 1,190,000 ....... ....... Prepaid expenses 250,000 229.000 ........ Total current assets.. $3,690,000 $3,089,000 ........ .......... Long-term investments.... Property, plant, and equipment (net) Total assets. 2,350,000 2,300,000 ..... 3,740,000 3.366.000 $9,780,000 $8,755.000 Liabilities Current liabilities.. Long-term liabilities: $ 900,000 $ 80.000 $ 200,000 S Mortgage note payable, 10%. Bonds payable, 10%... 1,500,000 $1,700,000 $2.600,000 $2.380.000 1,500.000 $1,500.000 ..... Total long-term liabilities Total liabilities. .. Stockholders' Equity Preferred $0.90 stock, $10 par Common stock, $5 par.... Retained earnings.... Total stockholders' equity.... Total liabilities and stockholders'equity. $ 500,000 $ so0,000 s00,000 500,000 6,180,000 $7.180,000 56.375,000 $9.780,000 58.755.000 5375.000 Stargel Inc. Comparative Retained Earnings Statement For the Years Ended December 31, 20Y2 and 20Y1 20Y2 20Y1 $5,375,000 Retained earnings, January 1. Net income.. Total .. Dividends: On preferred stock On common stock... Total dividends.. Retained earnings, December 31 $4,545,000 925,000 $5,470,000 900,000 $6,275,000 $ 45,000 50,000 $ 95,000 $6,180,000 $ 45,000 .. 50,000 $ 95,000 $5,375,000 Instructions Determine the following measures for 20Y2, rounding to one decimal place including percentages, except for per-share amounts:

Intermediate Accounting: Reporting And Analysis
3rd Edition
ISBN:9781337788281
Author:James M. Wahlen, Jefferson P. Jones, Donald Pagach
Publisher:James M. Wahlen, Jefferson P. Jones, Donald Pagach
Chapter5: The Income Statement And The Statement Of Cash Flows
Section: Chapter Questions
Problem 1RE: Brandt Corporation had sales revenue of 500,000 for the current year. For the year, its cost of...

Related questions
Question
I already have the first 4 down
working capital value: $2,790,000
current ratio value: 4.1
quick ratio: 2.5
accounts receivable turnover: 16
if someone can please please pleassseee help me with 5-18 please. I have been so stressed with this question and i just need answer and explanation please
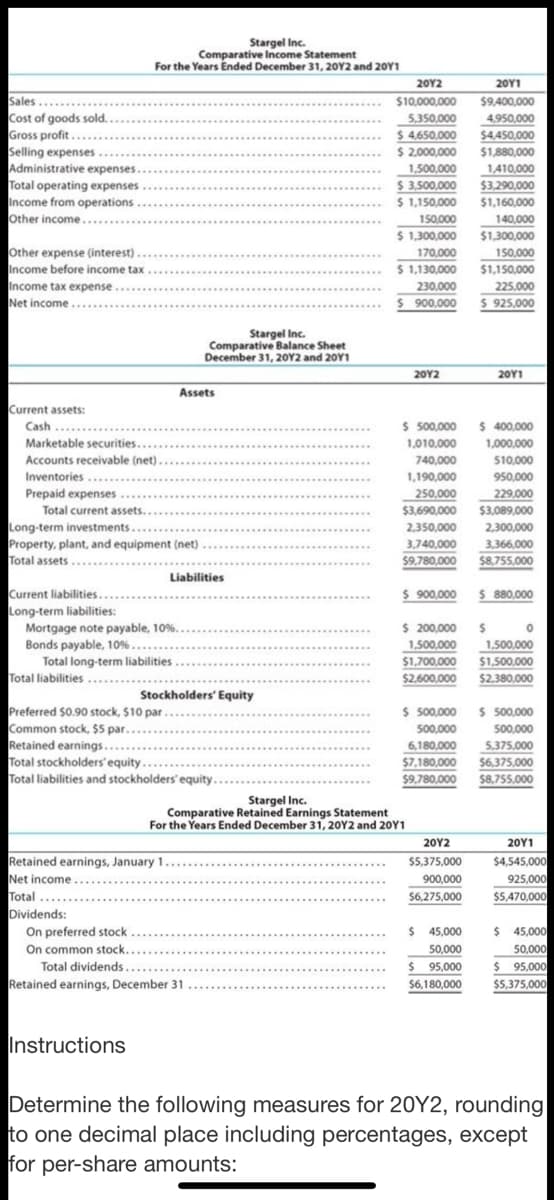
Transcribed Image Text:Stargel Inc.
Comparative Income Statement
For the Years Ended December 31, 20Y2 and 20Y1
20Y2
$10,000,000
20Υ1
Sales .....
$9,400,000
Cost of goods sold.
Gross profit.
Selling expenses..
Administrative expenses.
Total operating expenses
Income from operations.
other income.
5,350,000
4,950,000
$ 4,650,000
$4450,000
2,000,000
$1,880,000
1,500,000
1,410,000
$ 3,500,000
$ 1,150,000
$3.290,000
$1,160,000
150,000
140,000
$ 1,300.000
$1,300,000
Other expense (interest)..
Income before income tax
Income tax expense.
Net income..
170,000
150,000
$ 1,130,000
$1,150,000
230.000
$ 900,000
225.000
$ 925,000
Stargel Inc.
Comparative Balance Sheet
December 31, 20Y2 and 20Y1
20Y2
20Y1
Assets
Current assets:
$ 400,000
$ 500,000
1,010,000
Cash
Marketable securities.
1,000,000
Accounts receivable (net).
740,000
1,190,000
510,000
Inventories
950,000
Prepaid expenses
250,000
229.000
Total current assets..
$3,690,000
$3,089,000
Long-term investments..
Property, plant, and equipment (net)
Total assets.
2,350,000
2,300,000
3,740,000
3,366,000
$9.780,000
$8,755,000
Liabilities
Current liabilities...
Long-term liabilities:
Mortgage note payable, 10%.
Bonds payable, 10% ...
$ 900,000
$ 880,000
$ 200,000
1,500,000
1,500,000
$1,500,000
$2.380.000
Total long-term liabilities.
$1,700,000
Total liabilities
$2,600,000
.....
Stockholders' Equity
Preferred $0.90 stock, $10 par
Common stock, $5 par....
Retained earnings....
Total stockholders' equity...
Total liabilities and stockholders' equity.
$ 500,000
$ 500,000
.......
500,000
500,000
6,180,000
5.375,000
$7,180,000
$6.375.000
$9.780,000 $8.755.000
Stargel Inc.
Comparative Retained Earnings Statement
For the Years Ended December 31, 20Y2 and 20Y1
20Y1
$4,545,000
925,000
20Y2
Retained earnings, January 1.
.
$5,375,000
Net income
900,000
$6,275,000
Total
$5,470,000
Dividends:
On preferred stock
On common stock..
Total dividends...
Retained earnings, December 31
$ 45,000
$ 45,000
50,000
$ 95,000
$5,375,000
50,000
$ 95,000
$6,180,000
Instructions
Determine the following measures for 20Y2, rounding
to one decimal place including percentages, except
for per-share amounts:
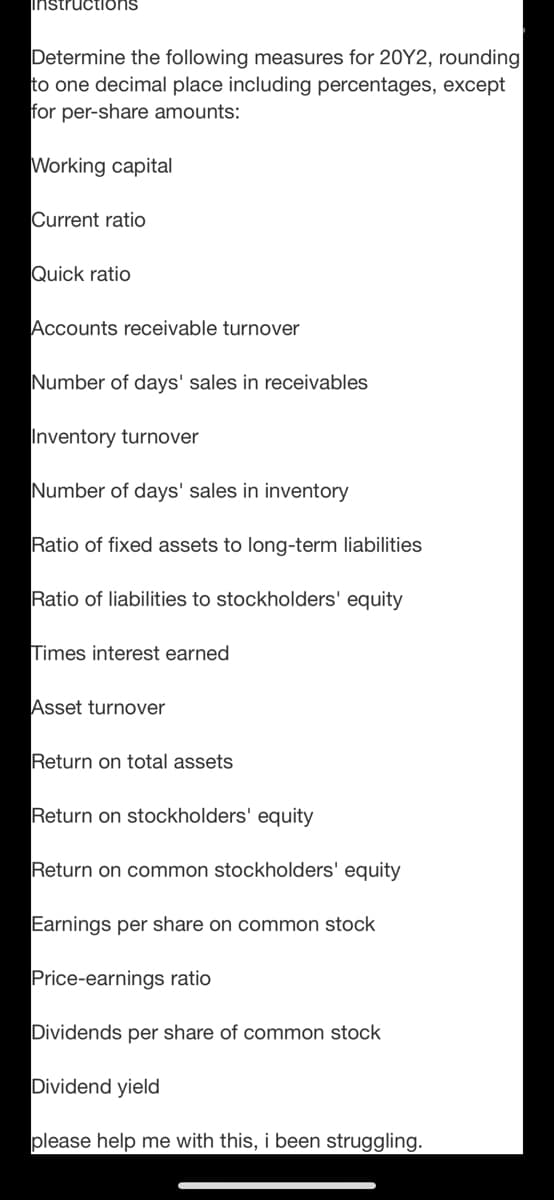
Transcribed Image Text:instructioOns
Determine the following measures for 20Y2, rounding
to one decimal place including percentages, except
for per-share amounts:
Working capital
Current ratio
Quick ratio
Accounts receivable turnover
Number of days' sales in receivables
Inventory turnover
Number of days' sales in inventory
Ratio of fixed assets to long-term liabilities
Ratio of liabilities to stockholders' equity
Times interest earned
Asset turnover
Return on total assets
Return on stockholders' equity
Return on common stockholders' equity
Earnings per share on common stock
Price-earnings ratio
Dividends per share of common stock
Dividend yield
please help me with this, i been struggling.
Expert Solution
This question has been solved!
Explore an expertly crafted, step-by-step solution for a thorough understanding of key concepts.

This is a popular solution!

Trending now
This is a popular solution!

Step by step
Solved in 2 steps

Knowledge Booster


Learn more about
Need a deep-dive on the concept behind this application? Look no further. Learn more about this topic, accounting and related others by exploring similar questions and additional content below.Recommended textbooks for you
Intermediate Accounting: Reporting And Analysis
Accounting
ISBN:
9781337788281
Author:
James M. Wahlen, Jefferson P. Jones, Donald Pagach
Publisher:
Cengage Learning

Fundamentals of Financial Management (MindTap Cou…
Finance
ISBN:
9781337395250
Author:
Eugene F. Brigham, Joel F. Houston
Publisher:
Cengage Learning

Survey of Accounting (Accounting I)
Accounting
ISBN:
9781305961883
Author:
Carl Warren
Publisher:
Cengage Learning
Intermediate Accounting: Reporting And Analysis
Accounting
ISBN:
9781337788281
Author:
James M. Wahlen, Jefferson P. Jones, Donald Pagach
Publisher:
Cengage Learning
Fundamentals of Financial Management (MindTap Cou…
Finance
ISBN:
9781337395250
Author:
Eugene F. Brigham, Joel F. Houston
Publisher:
Cengage Learning
Survey of Accounting (Accounting I)
Accounting
ISBN:
9781305961883
Author:
Carl Warren
Publisher:
Cengage Learning

Financial And Managerial Accounting
Accounting
ISBN:
9781337902663
Author:
WARREN, Carl S.
Publisher:
Cengage Learning,

Cornerstones of Financial Accounting
Accounting
ISBN:
9781337690881
Author:
Jay Rich, Jeff Jones
Publisher:
Cengage Learning

Financial Accounting: The Impact on Decision Make…
Accounting
ISBN:
9781305654174
Author:
Gary A. Porter, Curtis L. Norton
Publisher:
Cengage Learning