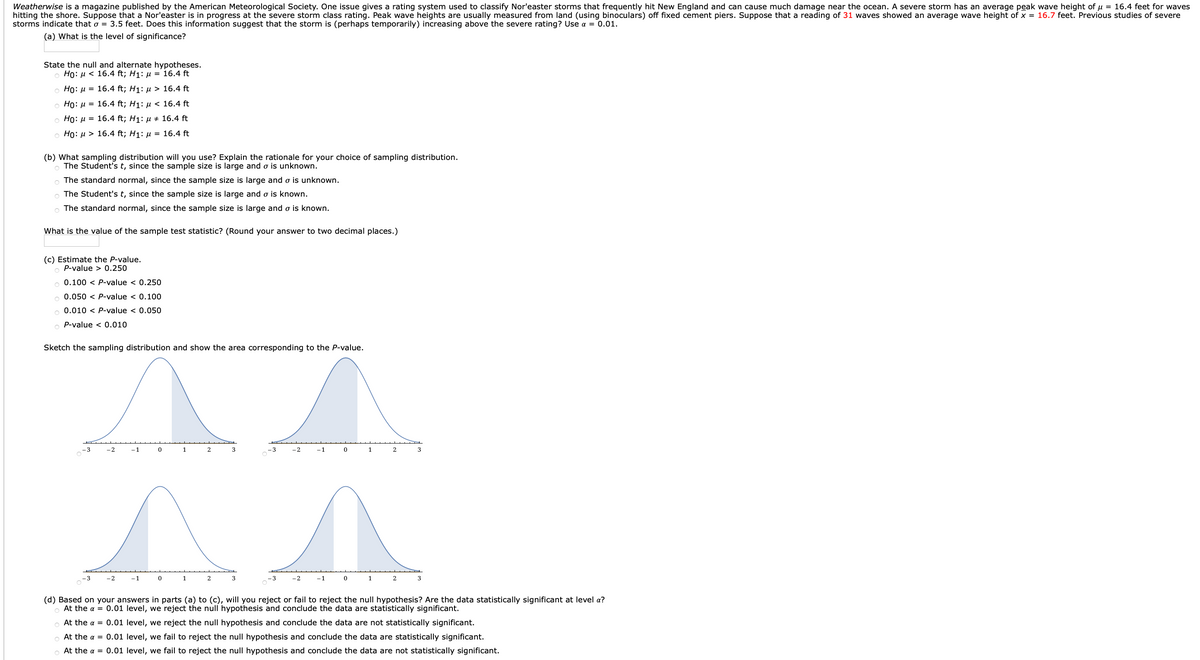
State the null and alternate hypotheses. Ho: H< 16.4 ft; H:- 16.4t Họ: H- 16.4 t; Hạ: > 16.4 t Họ: H- 16.4 t; H< 16.4 ft Họ: H- 16.4 t; H: 16.4 Ho: H> 16.4 t; Hạ: - 16.4 ft (b) What sampling distribution will you use? Explain the rationale for your choice of sampling distribution. The Student's t, since the sample size is large and o is unknown. The standard normal, since the sample size is large and e is unknown. The Student's t, since the sample size is large and o is known. The standard normal, since the sample size is large and a is known. What is the value of the sample test statistic? (Round your answer to two decimal places.) (c) Estimate the Pvalue. Pvalue > 0.25o 0.100 < P-value < 0.250 0.050 < P-value < 0.100 0.010 < P-value < 0.050 Pvalue < 0.010 Sketch the sampling distribution and show the area corresponding to the Pvalue. (d) Based on your answers in parts (a) to (c), will you reject or fail to reject the null hypothesis? Are the data statistically significant at level a? At the a-0.01 level, we reject the null hypothesis and conclude the data are statistically significant. At the a- 0.01 level, we reject the null hypothesis and conclude the data are not statistically significant. At the a-0.01 level, we fail to reject the null hypothesis and conclude the data are statistically significant. At the a- 0.01 level, we fail to reject the null hypothesis and conclude the data are not statistically significant.

Mathematics For Machine Technology
8th Edition
ISBN:9781337798310
Author:Peterson, John.
Publisher:Peterson, John.
Chapter48: Applications Of Formulas To Spur Gears
Section: Chapter Questions
Problem 23A
icon
Related questions
icon
Concept explainers
Question
Weatherwise is a magazine published by the American Meteorological Society. One issue gives a rating system used to classify Nor'easter storms that frequently hit New England and can cause much damage near the ocean. A severe storm has an average peak wave height of u = 16.4 feet for waves
hitting the shore. Suppose that a Nor'easter is in progress at the severe storm class rating. Peak wave heights are usually measured from land (using binoculars) off fixed cement piers. Suppose that a reading of 31 waves showed an average wave height of x = 16.7 feet. Previous studies of severe
storms indicate that o = 3.5 feet. Does this information suggest that the storm is (perhaps temporarily) increasing above the severe rating? Use a = 0.01.
(a) What is the level of significance?
State the null and alternate hypotheses.
o Ho: µ < 16.4 ft; H1: µ = 16.4 ft
o Ho: µ = 16.4 ft; H1: µ > 16.4 ft
o Ho: µ = 16.4 ft; H1: µ < 16.4 ft
o Ho: µ = 16.4 ft; H1: µ # 16.4 ft
o Ho: µ > 16.4 ft; H1: µ = 16.4 ft
(b) What sampling distribution will you use? Explain the rationale for your choice of sampling distribution.
o The Student's t, since the sample size is large and o is unknown.
o The standard normal, since the sample size is large and o is unknown.
O The Student's t, since the sample size is large and o is known.
The standard normal, since the sample size is large and o is known.
What is the value of the sample test statistic? (Round your answer to two decimal places.)
(c) Estimate the P-value.
O P-value > 0.250
O 0.100 < P-value < 0.250
O 0.050 < P-value < 0.100
o 0.010 < P-value < 0.050
o P-value < 0.010
Sketch the sampling distribution and show the area corresponding to the P-value.
- 3
-2
-1
1
2
3
-2
-1
1
3
-3
-2
-1
1
2
3
-3
-2
-1
1
2
3
(d) Based on your answers in parts (a) to (c), will you reject or fail to reject the null hypothesis? Are the data statistically significant at level a?
At the a = 0.01 level, we reject the null hypothesis and conclude the data are statistically significant.
At the a = 0.01 level, we reject the null hypothesis and conclude the data are not statistically significant.
o At the a = 0.01 level, we fail to reject the nullI hypothesis and conclude the data are statistically significant.
At the a = 0.01 level, we fail to reject the null hypothesis and conclude the data are not statistically significant.
Transcribed Image Text:Weatherwise is a magazine published by the American Meteorological Society. One issue gives a rating system used to classify Nor'easter storms that frequently hit New England and can cause much damage near the ocean. A severe storm has an average peak wave height of u = 16.4 feet for waves hitting the shore. Suppose that a Nor'easter is in progress at the severe storm class rating. Peak wave heights are usually measured from land (using binoculars) off fixed cement piers. Suppose that a reading of 31 waves showed an average wave height of x = 16.7 feet. Previous studies of severe storms indicate that o = 3.5 feet. Does this information suggest that the storm is (perhaps temporarily) increasing above the severe rating? Use a = 0.01. (a) What is the level of significance? State the null and alternate hypotheses. o Ho: µ < 16.4 ft; H1: µ = 16.4 ft o Ho: µ = 16.4 ft; H1: µ > 16.4 ft o Ho: µ = 16.4 ft; H1: µ < 16.4 ft o Ho: µ = 16.4 ft; H1: µ # 16.4 ft o Ho: µ > 16.4 ft; H1: µ = 16.4 ft (b) What sampling distribution will you use? Explain the rationale for your choice of sampling distribution. o The Student's t, since the sample size is large and o is unknown. o The standard normal, since the sample size is large and o is unknown. O The Student's t, since the sample size is large and o is known. The standard normal, since the sample size is large and o is known. What is the value of the sample test statistic? (Round your answer to two decimal places.) (c) Estimate the P-value. O P-value > 0.250 O 0.100 < P-value < 0.250 O 0.050 < P-value < 0.100 o 0.010 < P-value < 0.050 o P-value < 0.010 Sketch the sampling distribution and show the area corresponding to the P-value. - 3 -2 -1 1 2 3 -2 -1 1 3 -3 -2 -1 1 2 3 -3 -2 -1 1 2 3 (d) Based on your answers in parts (a) to (c), will you reject or fail to reject the null hypothesis? Are the data statistically significant at level a? At the a = 0.01 level, we reject the null hypothesis and conclude the data are statistically significant. At the a = 0.01 level, we reject the null hypothesis and conclude the data are not statistically significant. o At the a = 0.01 level, we fail to reject the nullI hypothesis and conclude the data are statistically significant. At the a = 0.01 level, we fail to reject the null hypothesis and conclude the data are not statistically significant.
Expert Solution
trending now

Trending now

This is a popular solution!

steps

Step by step

Solved in 2 steps with 1 images

Blurred answer
Knowledge Booster
Conditional Probability, Decision Trees, and Bayes' Theorem
Learn more about
Need a deep-dive on the concept behind this application? Look no further. Learn more about this topic, statistics and related others by exploring similar questions and additional content below.
Recommended textbooks for you
Mathematics For Machine Technology
Advanced Math
ISBN:
9781337798310
Author:
Peterson, John.
Publisher:
Cengage Learning,
Elementary Geometry for College Students
Geometry
ISBN:
9781285195698
Author:
Daniel C. Alexander, Geralyn M. Koeberlein
Publisher:
Cengage Learning
Algebra: Structure And Method, Book 1
Algebra
ISBN:
9780395977224
Author:
Richard G. Brown, Mary P. Dolciani, Robert H. Sorgenfrey, William L. Cole
Publisher:
McDougal Littell
Glencoe Algebra 1, Student Edition, 9780079039897…
Algebra
ISBN:
9780079039897
Author:
Carter
Publisher:
McGraw Hill