What are we testing in this problem? O single mean O single proportion (a) What is the level of significance? State the null and alternate hypotheses. O Ho: p = 0.35; H1: p < 0.35 O Ho: H = 0.35; H1: µ > 0.35 O Ho: p = 0.35; H1: p # 0.35 O Ho: p = 0.35; H1: p > 0.35 O Ho: H = 0.35; H1: µ < 0.35 O Ho: H = 0.35; H1: µ # 0.35 (b) What sampling distribution will you use? What assumptions are you making? O The standard normal, since np > 5 and nq > 5. O The Student's t, since np > 5 and ng > 5. O The Student's t, since np < 5 and nq < 5. O The standard normal, since np < 5 and ng < 5. What is the value of the sample test statistic? (Round your answer to two decimal places.) (c) Find (or estimate) the P-value. O P-value > 0.250 O 0.125 < P-value < 0.250 O 0.050 < P-value < 0.125 O 0.025 < P-value < 0.050 O 0.005 < P-value < 0.025 O P-value < 0.005 Sketch the sampling distribution and show the area corresponding to the P- value.
What are we testing in this problem? O single mean O single proportion (a) What is the level of significance? State the null and alternate hypotheses. O Ho: p = 0.35; H1: p < 0.35 O Ho: H = 0.35; H1: µ > 0.35 O Ho: p = 0.35; H1: p # 0.35 O Ho: p = 0.35; H1: p > 0.35 O Ho: H = 0.35; H1: µ < 0.35 O Ho: H = 0.35; H1: µ # 0.35 (b) What sampling distribution will you use? What assumptions are you making? O The standard normal, since np > 5 and nq > 5. O The Student's t, since np > 5 and ng > 5. O The Student's t, since np < 5 and nq < 5. O The standard normal, since np < 5 and ng < 5. What is the value of the sample test statistic? (Round your answer to two decimal places.) (c) Find (or estimate) the P-value. O P-value > 0.250 O 0.125 < P-value < 0.250 O 0.050 < P-value < 0.125 O 0.025 < P-value < 0.050 O 0.005 < P-value < 0.025 O P-value < 0.005 Sketch the sampling distribution and show the area corresponding to the P- value.

College Algebra (MindTap Course List)
12th Edition
ISBN:9781305652231
Author:R. David Gustafson, Jeff Hughes
Publisher:R. David Gustafson, Jeff Hughes
Chapter8: Sequences, Series, And Probability
Section8.7: Probability
Problem 58E: What is meant by the sample space of an experiment?

Related questions
Topic Video
Question
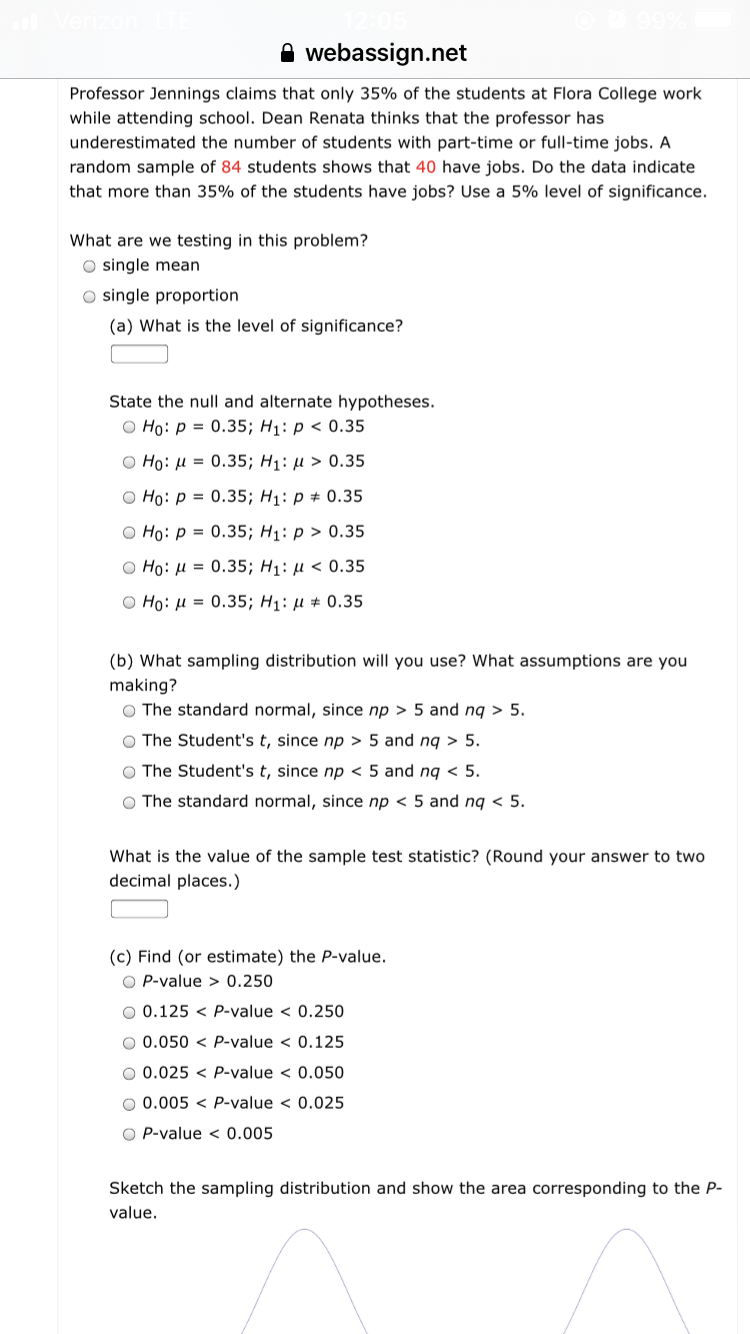
Transcribed Image Text:What are we testing in this problem?
O single mean
O single proportion
(a) What is the level of significance?
State the null and alternate hypotheses.
O Ho: p = 0.35; H1: p < 0.35
O Ho: H = 0.35; H1: µ > 0.35
O Ho: p = 0.35; H1: p # 0.35
O Ho: p = 0.35; H1: p > 0.35
O Ho: H = 0.35; H1: µ < 0.35
O Ho: H = 0.35; H1: µ # 0.35
(b) What sampling distribution will you use? What assumptions are you
making?
O The standard normal, since np > 5 and nq > 5.
O The Student's t, since np > 5 and ng > 5.
O The Student's t, since np < 5 and nq < 5.
O The standard normal, since np < 5 and ng < 5.
What is the value of the sample test statistic? (Round your answer to two
decimal places.)
(c) Find (or estimate) the P-value.
O P-value > 0.250
O 0.125 < P-value < 0.250
O 0.050 < P-value < 0.125
O 0.025 < P-value < 0.050
O 0.005 < P-value < 0.025
O P-value < 0.005
Sketch the sampling distribution and show the area corresponding to the P-
value.
Expert Solution
This question has been solved!
Explore an expertly crafted, step-by-step solution for a thorough understanding of key concepts.

This is a popular solution!

Trending now
This is a popular solution!

Step by step
Solved in 2 steps with 2 images

Knowledge Booster


Learn more about
Need a deep-dive on the concept behind this application? Look no further. Learn more about this topic, statistics and related others by exploring similar questions and additional content below.Recommended textbooks for you
College Algebra (MindTap Course List)
Algebra
ISBN:
9781305652231
Author:
R. David Gustafson, Jeff Hughes
Publisher:
Cengage Learning
College Algebra (MindTap Course List)
Algebra
ISBN:
9781305652231
Author:
R. David Gustafson, Jeff Hughes
Publisher:
Cengage Learning