State the null and alternative hypotheses. O Hoi Hy # Hz# Hz Hi H1 = H2 = Hz O Ho: Not all the population means are equal. H3i Hy = Hz = Hz o: At least two of the population means are equal. : At least two of the population means are different. O Ho: Hq = Hz = H3 : Not all the population means are equal. O Hoi Hq = Hz = H3 Hgi Hy # Hz # Hz Find the value of the test statistic. (Round your answer to two decimal places.) Find the p-value. (Round your answer to four decimal places.) p-value = State your conclusion. Reject Hp. There is sufficient evidence to conclude that the means for the three plants are not equal. O Reject Ho. There is not sufficient evidence to conclude that the means for the three plants are not equal. O Do not reject H,. There is sufficient evidence to conclude that the means for the three plants are not equal. O Do not reject Họ. There is not sufficient evidence to conclude that the means for the three plants are not equal.
State the null and alternative hypotheses. O Hoi Hy # Hz# Hz Hi H1 = H2 = Hz O Ho: Not all the population means are equal. H3i Hy = Hz = Hz o: At least two of the population means are equal. : At least two of the population means are different. O Ho: Hq = Hz = H3 : Not all the population means are equal. O Hoi Hq = Hz = H3 Hgi Hy # Hz # Hz Find the value of the test statistic. (Round your answer to two decimal places.) Find the p-value. (Round your answer to four decimal places.) p-value = State your conclusion. Reject Hp. There is sufficient evidence to conclude that the means for the three plants are not equal. O Reject Ho. There is not sufficient evidence to conclude that the means for the three plants are not equal. O Do not reject H,. There is sufficient evidence to conclude that the means for the three plants are not equal. O Do not reject Họ. There is not sufficient evidence to conclude that the means for the three plants are not equal.

Glencoe Algebra 1, Student Edition, 9780079039897, 0079039898, 2018
18th Edition
ISBN:9780079039897
Author:Carter
Publisher:Carter
Chapter10: Statistics
Section10.4: Distributions Of Data
Problem 19PFA

Related questions
Question
100%
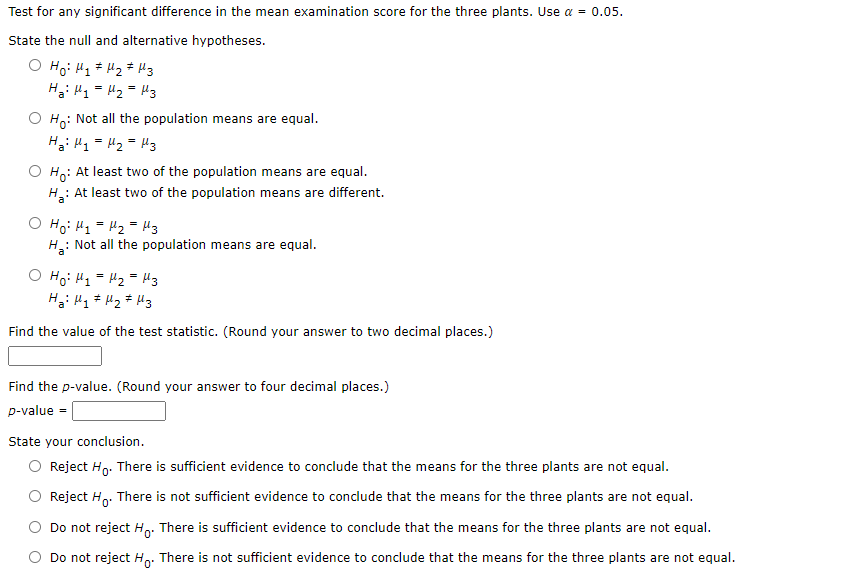
Transcribed Image Text:Test for any significant difference in the mean examination score for the three plants. Use a = 0.05.
State the null and alternative hypotheses.
Hi H1 = H2 = Hz
Ho: Not all the population means are equal.
Hi H1 = H2 = H3
O Ho: At least two of the population means are equal.
: At least two of the population means are different.
Ho: H1 = Hz = Mz
: Not all the population means are equal.
Hai
O Ho: H1 = H2 = H3
Find the value of the test statistic. (Round your answer to two decimal places.)
Find the p-value. (Round your answer to four decimal places.)
p-value =
State your conclusion.
O Reject Ho. There is sufficient evidence to conclude that the means for the three plants are not equal.
Reject H. There is not sufficient evidence to conclude that the means for the three plants are not equal.
Do not reject Hp. There is sufficient evidence to conclude that the means for the three plants are not equal.
Do not reject Ho: There is not sufficient evidence to conclude that the means for the three plants are not equal.
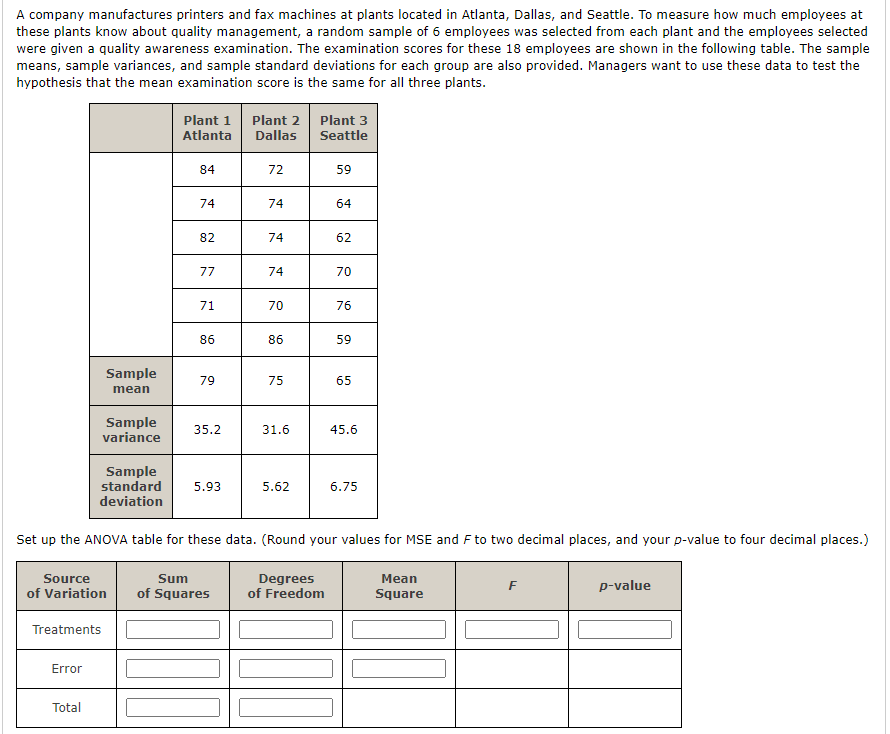
Transcribed Image Text:A company manufactures printers and fax machines at plants located in Atlanta, Dallas, and Seattle. To measure how much employees at
these plants know about quality management, a random sample of 6 employees was selected from each plant and the employees selected
were given a quality awareness examination. The examination scores for these 18 employees are shown in the following table. The sample
means, sample variances, and sample standard deviations for each group are also provided. Managers want to use these data to test the
hypothesis that the mean examination score is the same for all three plants.
Plant 1
Atlanta
Plant 2 Plant 3
Dallas
Seattle
84
72
59
74
74
64
82
74
62
77
74
70
71
70
76
86
86
59
Sample
79
75
65
mean
Sample
variance
35.2
31.6
45.6
Sample
standard
deviation
5.93
5.62
6.75
Set up the ANOVA table for these data. (Round your values for MSE and F to two decimal places, and your p-value to four decimal places.)
Source
Sum
Degrees
of Freedom
Mean
F
p-value
of Variation
of Squares
Square
Treatments
Error
Total
Expert Solution
This question has been solved!
Explore an expertly crafted, step-by-step solution for a thorough understanding of key concepts.

Step by step
Solved in 2 steps with 1 images

Knowledge Booster


Learn more about
Need a deep-dive on the concept behind this application? Look no further. Learn more about this topic, statistics and related others by exploring similar questions and additional content below.Recommended textbooks for you
Glencoe Algebra 1, Student Edition, 9780079039897…
Algebra
ISBN:
9780079039897
Author:
Carter
Publisher:
McGraw Hill

College Algebra (MindTap Course List)
Algebra
ISBN:
9781305652231
Author:
R. David Gustafson, Jeff Hughes
Publisher:
Cengage Learning
Glencoe Algebra 1, Student Edition, 9780079039897…
Algebra
ISBN:
9780079039897
Author:
Carter
Publisher:
McGraw Hill
College Algebra (MindTap Course List)
Algebra
ISBN:
9781305652231
Author:
R. David Gustafson, Jeff Hughes
Publisher:
Cengage Learning