State the null hypothesis. Ο 1 : μ 19 Ο 16: μ+ 19 Ο Hρ μ2 19 Ο 16 μ 19 - Part (b) State the alternative hypothesis. O Hgi H # 19 Ο H, με 19 Ο H,μ 19 Ο H, μ 19 O Part (c) In words, state what your random variable X represents. O represents the age of a person when he or she first began smoking. X represents the average number of cigarettes for each smoker. O xrepresents the average age when smokers first start to smoke. O xrepresents the average age of the sample of smokers.
State the null hypothesis. Ο 1 : μ 19 Ο 16: μ+ 19 Ο Hρ μ2 19 Ο 16 μ 19 - Part (b) State the alternative hypothesis. O Hgi H # 19 Ο H, με 19 Ο H,μ 19 Ο H, μ 19 O Part (c) In words, state what your random variable X represents. O represents the age of a person when he or she first began smoking. X represents the average number of cigarettes for each smoker. O xrepresents the average age when smokers first start to smoke. O xrepresents the average age of the sample of smokers.

Algebra & Trigonometry with Analytic Geometry
13th Edition
ISBN:9781133382119
Author:Swokowski
Publisher:Swokowski
Chapter10: Sequences, Series, And Probability
Section10.8: Probability
Problem 32E

Related questions

Question
From generation to generation, the mean age when smokers first start to smoke varies. However, the standard deviation of that age remains constant at around 2.1 years. A survey of 45 smokers of this generation was done to see if the mean starting age is at least 19. The sample mean was 18.1 with a sample standard deviation of 1.3. Do the data support the claim at the 5% level?
Note: If you are using a Student's t-distribution for the problem, you may assume that the underlying population is
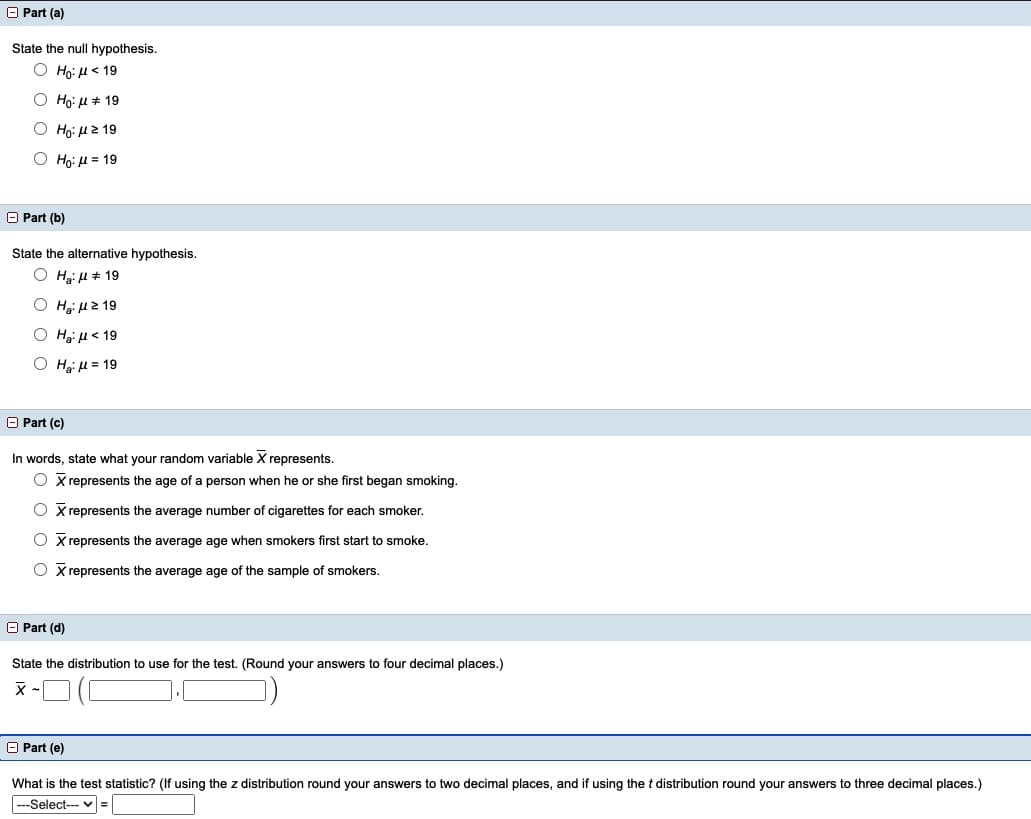
Transcribed Image Text:O Part (a)
State the null hypothesis.
Ο Ηρ μ< 19
Ο Hg: μ+ 19
Ho: H 2 19
Ο H, μ= 19
O Part (b)
State the alternative hypothesis.
Ο H μ+ 19
Hai H2 19
Ο H, μ< 19
Ο H, μ= 19
O Part (c)
In words, state what your random variable X represents.
O x represents the age of a person when he or she first began smoking.
X represents the average number of cigarettes for each smoker.
O X represents the average age when smokers first start to smoke.
O X represents the average age of the sample of smokers.
O Part (d)
State the distribution to use for the test. (Round your answers to four decimal places.)
O Part (e)
What is the test statistic? (If using the z distribution round your answers to two decimal places, and if using the t distribution round your answers to three decimal places.)
|---Select--- v =
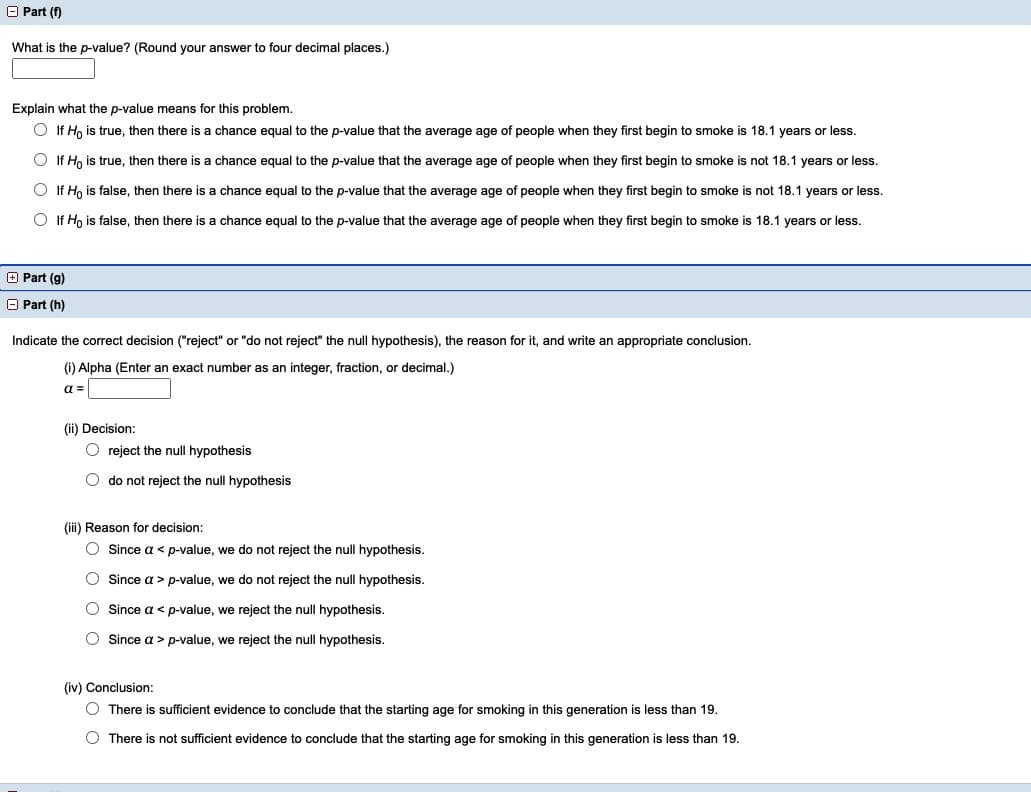
Transcribed Image Text:O Part (f)
What is the p-value? (Round your answer to four decimal places.)
Explain what the p-value means for this problem.
If Ho is true, then there is
chance equal to the p-value that the average age of people when they first begin to smoke is 18.1 years or less.
O If Ho is true, then there is a chance equal to the p-value that the average age of people when they first begin to smoke is not 18.1 years or less.
O If H, is false, then there is a chance equal to the p-value that the average age of people when they first begin to smoke is not 18.1 years or less.
O If Ho is false, then there is a chance equal to the p-value that the average age of people when they first begin to smoke is 18.1 years or less.
O Part (g)
O Part (h)
Indicate the correct decision ("reject" or "do not reject" the null hypothesis), the reason for it, and write an appropriate conclusion.
(i) Alpha (Enter an exact number as an integer, fraction, or decimal.)
a =
(ii) Decision:
O reject the null hypothesis
O do not reject the null hypothesis
(iii) Reason for decision:
O Since a < p-value, we do not reject the null hypothesis.
O Since a > p-value, we do not reject the null hypothesis.
O Since a < p-value, we reject the null hypothesis.
O Since a > p-value, we reject the null hypothesis.
(iv) Conclusion:
O There is sufficient evidence to conclude that the starting age for smoking in this generation is less than 19.
O There is not sufficient evidence to conclude that the starting age for smoking in this generation is less than 19.
Expert Solution
This question has been solved!
Explore an expertly crafted, step-by-step solution for a thorough understanding of key concepts.

This is a popular solution!

Trending now
This is a popular solution!

Step by step
Solved in 2 steps with 1 images

Knowledge Booster


Learn more about
Need a deep-dive on the concept behind this application? Look no further. Learn more about this topic, statistics and related others by exploring similar questions and additional content below.Recommended textbooks for you
Algebra & Trigonometry with Analytic Geometry
Algebra
ISBN:
9781133382119
Author:
Swokowski
Publisher:
Cengage

College Algebra
Algebra
ISBN:
9781305115545
Author:
James Stewart, Lothar Redlin, Saleem Watson
Publisher:
Cengage Learning
Algebra & Trigonometry with Analytic Geometry
Algebra
ISBN:
9781133382119
Author:
Swokowski
Publisher:
Cengage
College Algebra
Algebra
ISBN:
9781305115545
Author:
James Stewart, Lothar Redlin, Saleem Watson
Publisher:
Cengage Learning