Statista reports that the average monthly lease payment for an automobile is falling in the United States, but does this apply to all classes of automobiles? Suppose you are interested in whether this trend is true for sport utility vehicles (SUVS). Consider the following hypothetical monthly lease payment data for 33 randomly selected SUVs in 2015 and 46 randomly selected SUVs in 2016. 2015 692 684 550 546 576 711 501 742 556 646 764 549 769 602 633 674 781 674 659 566 749 482 770 506 718 589 743 605 530 734 927 661 658 2016 393 502 433 587 605 562 641 432 498 552 489 450 588 526 521 478 570 603 627 484 379 565 387 446 658 615 756 394 487 610 421 587 602 628 537 348 587 495 528 614 618 564 558 493 697 718 (a) Provide a point estimate (in $) of the difference between the population mean monthly lease payments for the two years. (Use SUVs in 2015 - SUVs in 2016. Round your answer to the nearest cent.) $ Interpret the point estimate Using the price-Select- ✓, the 2015 -Select- ✓for an SUV differs from the 2016-Select- (b) Develop a 99% confidence interval estimate (in $) of the difference between the mean monthly lease payments in 2015 and 2016. (Use SUVs in 2015 - SUVs in 2016. Round your answers to the nearest cent.) $ to $ (c) Would you feel justified in concluding that monthly lease payments have declined from 2015 to 2016? Why or why not? --Select-✓, because the 99% confidence intervall --Select-- ✓for an SUV by the amount of the point estimate. zero.
Statista reports that the average monthly lease payment for an automobile is falling in the United States, but does this apply to all classes of automobiles? Suppose you are interested in whether this trend is true for sport utility vehicles (SUVS). Consider the following hypothetical monthly lease payment data for 33 randomly selected SUVs in 2015 and 46 randomly selected SUVs in 2016. 2015 692 684 550 546 576 711 501 742 556 646 764 549 769 602 633 674 781 674 659 566 749 482 770 506 718 589 743 605 530 734 927 661 658 2016 393 502 433 587 605 562 641 432 498 552 489 450 588 526 521 478 570 603 627 484 379 565 387 446 658 615 756 394 487 610 421 587 602 628 537 348 587 495 528 614 618 564 558 493 697 718 (a) Provide a point estimate (in $) of the difference between the population mean monthly lease payments for the two years. (Use SUVs in 2015 - SUVs in 2016. Round your answer to the nearest cent.) $ Interpret the point estimate Using the price-Select- ✓, the 2015 -Select- ✓for an SUV differs from the 2016-Select- (b) Develop a 99% confidence interval estimate (in $) of the difference between the mean monthly lease payments in 2015 and 2016. (Use SUVs in 2015 - SUVs in 2016. Round your answers to the nearest cent.) $ to $ (c) Would you feel justified in concluding that monthly lease payments have declined from 2015 to 2016? Why or why not? --Select-✓, because the 99% confidence intervall --Select-- ✓for an SUV by the amount of the point estimate. zero.

MATLAB: An Introduction with Applications
6th Edition
ISBN:9781119256830
Author:Amos Gilat
Publisher:Amos Gilat
Chapter1: Starting With Matlab
Section: Chapter Questions
Problem 1P

Related questions
Question
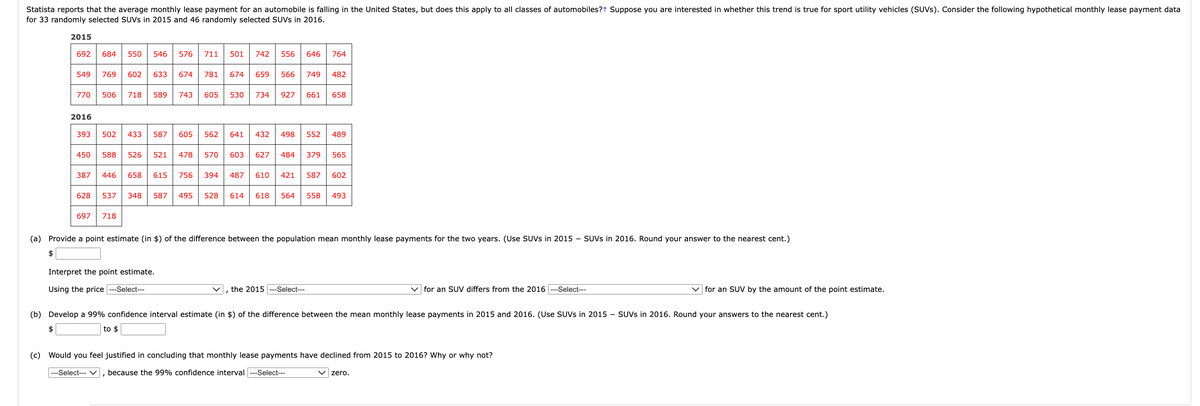
Transcribed Image Text:Statista reports that the average monthly lease payment for an automobile is falling in the United States, but does this apply to all classes of automobiles?+ Suppose you are interested in whether this trend is true for sport utility vehicles (SUVS). Consider the following hypothetical monthly lease payment data
for 33 randomly selected SUVs in 2015 and 46 randomly selected SUVs in 2016.
2015
692 684 550
549 769 602 633 674 781 674
$
2016
546 576 711 501
770 506 718 589 743 605 530 734 927 661 658
387 446 658
742 556
393 502 433 587 605 562 641 432 498 552 489
697 718
646 764
659 566 749 482
450 588 526 521 478 570 603 627 484 379 565
Interpret the point estimate.
Using the price ---Select---
615 756 394 487 610 421 587 602
628 537 348 587 495 528 614 618 564 558 493
(a) Provide a point estimate (in $) of the difference between the population mean monthly lease payments for the two years. (Use SUVs in 2015 - SUVS in 2016. Round your answer to the nearest cent.)
$
the 2015 ---Select---
for an SUV differs from the 2016 -Select---
(b) Develop a 99% confidence interval estimate (in $) of the difference between the mean monthly lease payments in 2015 and 2016. (Use SUVs in 2015 - SUVS in 2016. Round your answers to the nearest cent.)
to $
(c) Would you feel justified in concluding that monthly lease payments have declined from 2015 to 2016? Why or why not?
---Select--- ✓
because the 99% confidence interval ---Select---
zero.
for an SUV by the amount of the point estimate.
Expert Solution
This question has been solved!
Explore an expertly crafted, step-by-step solution for a thorough understanding of key concepts.

This is a popular solution!

Trending now
This is a popular solution!

Step by step
Solved in 5 steps with 19 images

Recommended textbooks for you
MATLAB: An Introduction with Applications
Statistics
ISBN:
9781119256830
Author:
Amos Gilat
Publisher:
John Wiley & Sons Inc

Probability and Statistics for Engineering and th…
Statistics
ISBN:
9781305251809
Author:
Jay L. Devore
Publisher:
Cengage Learning

Statistics for The Behavioral Sciences (MindTap C…
Statistics
ISBN:
9781305504912
Author:
Frederick J Gravetter, Larry B. Wallnau
Publisher:
Cengage Learning
MATLAB: An Introduction with Applications
Statistics
ISBN:
9781119256830
Author:
Amos Gilat
Publisher:
John Wiley & Sons Inc
Probability and Statistics for Engineering and th…
Statistics
ISBN:
9781305251809
Author:
Jay L. Devore
Publisher:
Cengage Learning
Statistics for The Behavioral Sciences (MindTap C…
Statistics
ISBN:
9781305504912
Author:
Frederick J Gravetter, Larry B. Wallnau
Publisher:
Cengage Learning

Elementary Statistics: Picturing the World (7th E…
Statistics
ISBN:
9780134683416
Author:
Ron Larson, Betsy Farber
Publisher:
PEARSON

The Basic Practice of Statistics
Statistics
ISBN:
9781319042578
Author:
David S. Moore, William I. Notz, Michael A. Fligner
Publisher:
W. H. Freeman

Introduction to the Practice of Statistics
Statistics
ISBN:
9781319013387
Author:
David S. Moore, George P. McCabe, Bruce A. Craig
Publisher:
W. H. Freeman