(b) Compute predicted values, a 95% confidence inter- val for mean wear, and a 95% prediction interval for observed wear if x1 = 20 and r2 = 1000.
Q: A bag contains 25 balls marked 1 to 25. One bau is arawn at randam. What is the probability that it ...
A:
Q: 1. Find the corresponding area between z= 0 and each of the follow ing: i. Z= 0.96 Z= 2.58 Z = 2.69 ...
A: As per our guidelines we are suppose to answer only one question. Required probability is P(0<Z&l...
Q: Consider the figure below and calculate the following probabilities: (a) P(C|A) (b) P(B|A N B) (c) P...
A: "Since you have posted a question with multiple subparts, we will solve first 3 sub-parts for you. T...
Q: A continuous random variable X has the density function given f(x)= A.e 6. Find the value of A and a...
A:
Q: How many apps? According to a website, the mean number of apps on a smartphone in the United States ...
A: GivenMean(μ)=89standard deviation(σ)=22
Q: Part 2 of 3 (b) What is the probability that the sample mean lifetime is less than 1540 hours? The p...
A: Let X be the random variable from normal distribution with mean (μ) = 1500 hours and standard deviat...
Q: Select at random, 200 University students from the list and send them a survey question online. what...
A: Option B is the answer. Answer : Simple Random Sampling Explanation : In the above example,200 Univ...
Q: Suppose the coffee industry claimed that the average adult drinks 1.7 cups of coffee per day. To tes...
A:
Q: Calculate the arithmetic mean from the following ta : Тетр. "С" No. of days -40 to -30 -30 to -20 -2...
A: We have given that. I want to find mean. Mean = sum of all observations/total number of observatio...
Q: State the following (a) Weak Law of Large numbers (b) Bernoulli's Law of Large numbers.
A:
Q: Find the area: Find the area under the standard normal curve. Round your answers to four decimal pla...
A: The standard normal variable is z, which follows the normal distribution with the mean of 0 and stan...
Q: * 012 = vn1(012+d12)+n2(o22+d22)/n1+n2 is Combined Standard Deviation Coefficient of variation O
A: The formula for two combined group is given and we have to determine what is it calculating.
Q: Find: (a) A' UB' (b) A' NB' (c) (A UB)'
A: It is given that The sets are defined as U = {1,2,3,4,5,6,7,8,9,10}, A = {1,2,4,6,8,10}, B = {1,3,5,...
Q: which of the following statements are true about probability: (a) a probability of 0 means that an ...
A: We have give that statement about probability
Q: 2. A teacher claims that his students have an average social media usage that is different from 1.83...
A: Introduction: t-test: The t-test is used if the sample size of the sample under study is small (le...
Q: The population mean for an IQ test is 100 and the population standard deviation is 15. You collect d...
A:
Q: 27. Discuss the effect of change of origin and scale on the moment generating function.
A:
Q: Read the given statement. Identify if the statements are True or False. First statement: Systematic ...
A:
Q: Question(14): A researcher wanted to know whether children who live in two different neighbourhood...
A: The appropriate conclusion regarding the mean amounts of exercise, that is received by the children ...
Q: Find the critical t value under the following one sample hypothesis testing for the population mean....
A: Here is given that population mean is 13 Level of significance is 10% and sample number is 28
Q: Example 19. From the chain base index number given below prepare fixed base index numbers. 2000 2001...
A:
Q: Area = 0.3577, Area = 0.0557 8.5 11.0 Part: 0 / 3 Part 1 of 3 (a) Find the proportion of cats who we...
A: Given
Q: Suppose IQ scores are approximately normally distributed with a mean of 100 and a standard deviation...
A: Given,mean(μ)=100standard deviation(σ)=15
Q: Using the Z table provided, find the value of a. P[-a < Z < a] = 0.9954
A:
Q: 2. Determine the Standard Deviation and Variance of the data set as shown and compare the results us...
A:
Q: When practicing basketball, Rachel has a 71% chance of making a free throw. She shoots 11 free throw...
A: Let the random variable X be the number of free throws from binomial distribution with probability (...
Q: The Commissioner of Jurors obtains a list of all drivers’ license ID numbers in Oneida County, about...
A: Given that, The Commissioner of Jurors obtains a list of all drivers’ license ID numbers in Oneida C...
Q: y (wear) #1 (oil viscosity) 2 (load) 193 230 172 91 1.6 851 816 1058 1201 15.5 22.0 43.0 113 33.0 13...
A: In this question given that table of wear and oil viscosity Find σ2 by using multiple regression
Q: For the frequency table shown below, answer the following questions. 1.What is the median of the dat...
A: Given data : 0,0,0,0,0,1,1,1,1,1,1,1,1,1,2,2,2,2,3,3,4,4,4
Q: I. Write True if the statement is Correct and False if the statement is wrong. 1. Qualitative data u...
A:
Q: There are hundreds of apples on the trees, so you randomly choose just 44 apples and get a mean weig...
A: We have given that, Sample mean (x̄) = 85.12, standard deviation (s) = 6.86, sample size (n) = 44 a...
Q: You may need to use the appropriate appendix table to answer this question. Given that z is a standa...
A: Let Z be the random variable from standard normal distribution with mean = 0 and standard deviation ...
Q: he researcher decided to conduct the study again and recruited an additional 10 children from the ...
A: Given :
Q: what is the obtained value? numerical only rounded to 2 decimal places heres th evalues M1=8.81 ...
A: Sample sizes n1=20 , n2=30 Sample means X̄1=8.81 , X̄2=8.79 s12 =67.62 , s...
Q: A depression study reports the following findings. There were no significant differences on depress...
A: Given that a depression study reports the following findings. There were no significant differences ...
Q: (f) Plot 95% confidence limits for the mean response on the graph around the regression line.
A: Soln ## R Code # Importing the dataset dataset = read.csv('Data_6Feb20.csv') head(dataset) ## a) Plo...
Q: Assume the random variable X is normally distributed with mean u= 50 and standard deviation o=7. Com...
A: Let X be the random variable from normal distribution with mean (μ) = 50 and standard deviation (σ)...
Q: Select all of the events that would be considered to be mutually exclusive events. O male and female...
A:
Q: The reading speed of second grade students in a large city is approximately normal, with a mean of 9...
A: Given : mean = 92 S.D = 10
Q: The yields of a genetically modified wheat (in bushels per acre) were compared for five different va...
A: “Since you have posted a question with multiple sub-parts, we will solve first three sub-parts for y...
Q: Rachel's null hypothesis is that the average calories in frozen Mac n Cheese is 350 (that is, the po...
A: Here Rachels Null Hypothesis is that the average calories in frozen Mac n Cheese is 350.
Q: The researcher decided to conduct the study again and selected an additional 10 children from the f...
A: The objective is to test whether the short-term memory recall of full-time kindergarten is better th...
Q: Based on the regression results, answer the following questions* A sample of data is collected (from...
A: There are 6 independent variable in the given output. CEOANN, EMPL, MKTVAL, and EPSIN are all signi...
Q: Calculate the arithmetic mean from the following đata : Тетр. "С" No. of days -40 to-30 -30 to -20 -...
A:
Q: mplete the missing value in the following table. Do NOT round your answer! Plan Sale Amount (in do...
A:
Q: The mean weight of 150 students in a class is 60 kg. The mean weight of boys in the class is 70 kg. ...
A:
Q: Which of the following characteristics do normal and uniform distributions have in common? A The dis...
A: Given that, Which of the following characteristics do normal and uniform distributions have in commo...
Q: Based on the regression results, answer the following questions** Data are collected on the income (...
A: (e) The objective is to check if any of the explanatory (independent) variables significant at the 1...
Q: Define the probability generating function of a random variable and discuss its properties.
A:
Q: In Alberta, a 9-1-1 dispatch center receives an average of 3.763 calls per day (that is, per a given...
A:
Answer Part B Only. Please and Thank You.
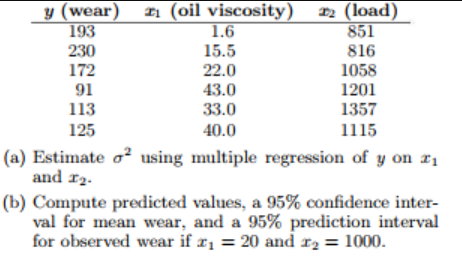
Step by step
Solved in 2 steps
- Given the table below, Let y, x1, x2, and x3 be the time of concentration (t, in hr), watershed length (L in ft), watershed slope (S in %), and runoff curve number (CN): Evaluate the linear multiple regression model with two or three predictor variables. Compute the multiple correlation coefficient, the standard error of estimate, and the standard deviation of the variable y. Discuss the reliability of the modelWhat is the slope coefficient for the horsepower variable? Is this coefficient significant at 5% level of significance (alpha=0.05)?For each residual plot below, decide on whether the usual assumptions:"Yi=B0+B1xi+ei,i=1,…,n,e1 independent N(0,sigma^2) random variables" of simple linear regression are valid or not.If some assumptions seem invalid, choose the options(s) which indicate the most obvious departures from the model assumptions. Note : For a small sample, the normality assumption cannot be "proved", but it can be "violated" if there is an extreme residual (outlier).Part a) y-axis has residual, x-axis has x-variable with values 1,2,...,10. (Click on graph to enlarge) Which is/are the best answer(s) for the residual plot (a)?A. linear relation assumption is invalidB. constant variance assumption is invalidC. assumptions seem reasonableD. the normality assumption is invalidE. None of the abovePart b) y-axis has residual, x-axis has x-variable with values 1,2,...,10. (Click on graph to enlarge) Which is/are the best answer(s) for the residual plot (b)?A. constant variance assumption is invalidB. the…
- A normal quantile plot of the residuals from this regression model should look like 1. Randomly scattered noise (watermelon seeds) 2. A normal distribution 3. A parabola 4. A uniform distribution 5. A line 6. SymmetricOn the first class exam, the coefficient of determination between the hours studied and the grade earned was 66%. The standard error of the estimate was 5. There were 15 students in the class. Develop an ANOVA table for the regression analysis of hours studied as a predictor of the grade earned on the first exam. (round answers to 2 decimal places) Source DF SS MS Regression Error TotalThe final test and exam averages for 20 randomly selected students taking a course in engineering statistics and a course in operations research follow. Assume that the final averages are jointly normally distributed.Find the regression line relating the statistics final average to the OR final average.(c) Estimate the correlation coefficient.
- Which of the following is not a plot of residuals typically used in multiple regression analysis? Select one: None of these Residuals versus correlation coefficients Residuals versus X1 Residuals versus time Residuals versus X2.Consider a linear regression model for the decrease in blood pressure (mmHg) over a four-week period with muy=2.8+0.8x and standard deviation chi=3.2. The explanatory variable x is the number of servings fruits and vegetables in a calorie-controlled diet. The decrease in blood pressure y will vary about this subpopulation mean. What is the distribution of y for this subpopulation?Which of the following would probably NOT be a potential “cure” for non-normal residuals? Select one: a. Transforming two explanatory variables into a ratio. b. Removing large negative residuals. c. Removing large positive residuals. d. Using a procedure for estimation and inference which did not assume normality.
- a.Calculate and interpret a 95 % CI for the population regression coefficient on x1 b. The estimated standard deviation of the predicted y when x1 = 400 and x2 = .125 is .180 . Calculate a 95 % CI for true average roughness under these circumstances.In bivariate regression, the amount of change in Y for one-unit change in X is: Group of answer choices Coiefficient Residual Slope Nove of the aboveYou are asked to do quality control and quality assurance during the determination of lead concentration in a city’s tap water using ICP-AES. Plotting ICP -AES signal as a function of lead concentration (in ppb) gave you a linear regression equation of y = 1.97x + 1.50 with an R^2=0.99. The instrumental response (signal) had a standard deviation of 0.75. What is the limit of quantitation in terms of lead concentration (ppb) of this instrumental method?