Stenback Company sells flags with team logos. Stenback has fixed costs of $1,260,000 per year plus variable costs of $4.50 per flag. Each flag sells for $15.00. Read the requirements Requirement 1. Use the equation approach to compute the number of flags Stenback must sell each year to break even. First, select the formula to compute the required sales in units to break even. Target profit Rearrange the formula you determined above and compute the required number of flags to break even. The number of flags Stenback must sell each year to break even is . Requirement 2. Use the contribution margin ratio approach to compute the dollar sales Stenback needs to earn $63,000 in operating income for 2018. (Round the contribution margin ratio to two decimal places.) Begin by showing the formula and then entering the amounts to calculate the required sales dollars to earn $63,000 in operating income. (Round the required sales in dollars up to the nearest whole dollar. For example, $10.25 would be rounded to $11. Abbreviation used: CM = contribution margin.) -- Required sales in dollars | + Requirement 3. Prepare Stenback's contribution margin income statement for the year ended December 31, 2018, for sales of 110,000 flags. (Round your final answers up to the next whole number.) (Use parentheses or a minus sign for an operating loss.) Stenback Company Contribution Margin Income Statement Year Ended December 31, 2018 Operating Income (Loss)
Stenback Company sells flags with team logos. Stenback has fixed costs of $1,260,000 per year plus variable costs of $4.50 per flag. Each flag sells for $15.00. Read the requirements Requirement 1. Use the equation approach to compute the number of flags Stenback must sell each year to break even. First, select the formula to compute the required sales in units to break even. Target profit Rearrange the formula you determined above and compute the required number of flags to break even. The number of flags Stenback must sell each year to break even is . Requirement 2. Use the contribution margin ratio approach to compute the dollar sales Stenback needs to earn $63,000 in operating income for 2018. (Round the contribution margin ratio to two decimal places.) Begin by showing the formula and then entering the amounts to calculate the required sales dollars to earn $63,000 in operating income. (Round the required sales in dollars up to the nearest whole dollar. For example, $10.25 would be rounded to $11. Abbreviation used: CM = contribution margin.) -- Required sales in dollars | + Requirement 3. Prepare Stenback's contribution margin income statement for the year ended December 31, 2018, for sales of 110,000 flags. (Round your final answers up to the next whole number.) (Use parentheses or a minus sign for an operating loss.) Stenback Company Contribution Margin Income Statement Year Ended December 31, 2018 Operating Income (Loss)

Managerial Accounting: The Cornerstone of Business Decision-Making
7th Edition
ISBN:9781337115773
Author:Maryanne M. Mowen, Don R. Hansen, Dan L. Heitger
Publisher:Maryanne M. Mowen, Don R. Hansen, Dan L. Heitger
Chapter7: Cost-volume-profit Analysis
Section: Chapter Questions
Problem 47E: Klamath Company produces a single product. The projected income statement for the coming year is as...

Related questions
Question
Hello,
I need help answering this question.
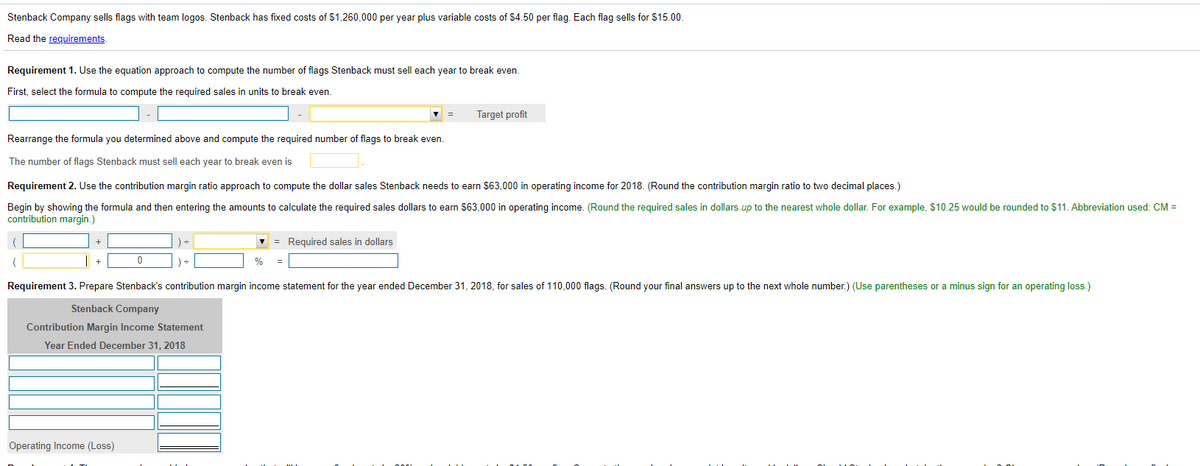
Transcribed Image Text:Stenback Company sells flags with team logos. Stenback has fixed costs of $1,260,000 per year plus variable costs of $4.50 per flag. Each flag sells for $15.00.
Read the reguirements.
Requirement 1. Use the equation approach to compute the number of flags Stenback must sell each year to break even.
First, select the formula to compute the required sales in units to break even.
Target profit
Rearrange the formula you determined above and compute the required number of flags to break even.
The number of flags Stenback must sell each year to break even is
Requirement 2. Use the contribution margin ratio approach to compute the dollar sales Stenback needs to earn $63,000 in operating income for 2018. (Round the contribution margin ratio to two decimal places.)
Begin by showing the formula and then entering the amounts to calculate the required sales dollars to earn $63,000 in operating income. (Round the required sales in dollars up to the nearest whole dollar. For example, $10.25 would be rounded to $11. Abbreviation used: CM =
contribution margin.)
v = Required sales in dollars
+
%
Requirement 3. Prepare Stenback's contribution margin income statement for the year ended December 31, 2018, for sales of 110,000 flags. (Round your final answers up to the next whole number.) (Use parentheses or a minus sign for an operating loss.)
Stenback Company
Contribution Margin Income Statement
Year Ended December 31, 2018
Operating Income (Loss)
Expert Solution
Step 1
CVP analysis is considered as a decision-making tool that helps management to make strategies and take wise decisions. It includes an analysis of contribution margin, Break-even point, Margin of safety, etc.

Trending now
This is a popular solution!

Step by step
Solved in 2 steps with 2 images

Knowledge Booster


Learn more about
Need a deep-dive on the concept behind this application? Look no further. Learn more about this topic, accounting and related others by exploring similar questions and additional content below.Recommended textbooks for you
Managerial Accounting: The Cornerstone of Busines…
Accounting
ISBN:
9781337115773
Author:
Maryanne M. Mowen, Don R. Hansen, Dan L. Heitger
Publisher:
Cengage Learning

Principles of Accounting Volume 2
Accounting
ISBN:
9781947172609
Author:
OpenStax
Publisher:
OpenStax College

Cornerstones of Cost Management (Cornerstones Ser…
Accounting
ISBN:
9781305970663
Author:
Don R. Hansen, Maryanne M. Mowen
Publisher:
Cengage Learning
Managerial Accounting: The Cornerstone of Busines…
Accounting
ISBN:
9781337115773
Author:
Maryanne M. Mowen, Don R. Hansen, Dan L. Heitger
Publisher:
Cengage Learning
Principles of Accounting Volume 2
Accounting
ISBN:
9781947172609
Author:
OpenStax
Publisher:
OpenStax College
Cornerstones of Cost Management (Cornerstones Ser…
Accounting
ISBN:
9781305970663
Author:
Don R. Hansen, Maryanne M. Mowen
Publisher:
Cengage Learning

Principles of Cost Accounting
Accounting
ISBN:
9781305087408
Author:
Edward J. Vanderbeck, Maria R. Mitchell
Publisher:
Cengage Learning

EBK CONTEMPORARY FINANCIAL MANAGEMENT
Finance
ISBN:
9781337514835
Author:
MOYER
Publisher:
CENGAGE LEARNING - CONSIGNMENT