Step 3: Find the p-value of the test statistic. P(FSV p-value ZA = 8A== 11 IB == SB==
Glencoe Algebra 1, Student Edition, 9780079039897, 0079039898, 2018
18th Edition
ISBN:9780079039897
Author:Carter
Publisher:Carter
Chapter10: Statistics
Section10.6: Summarizing Categorical Data
Problem 10CYU
Related questions
Question

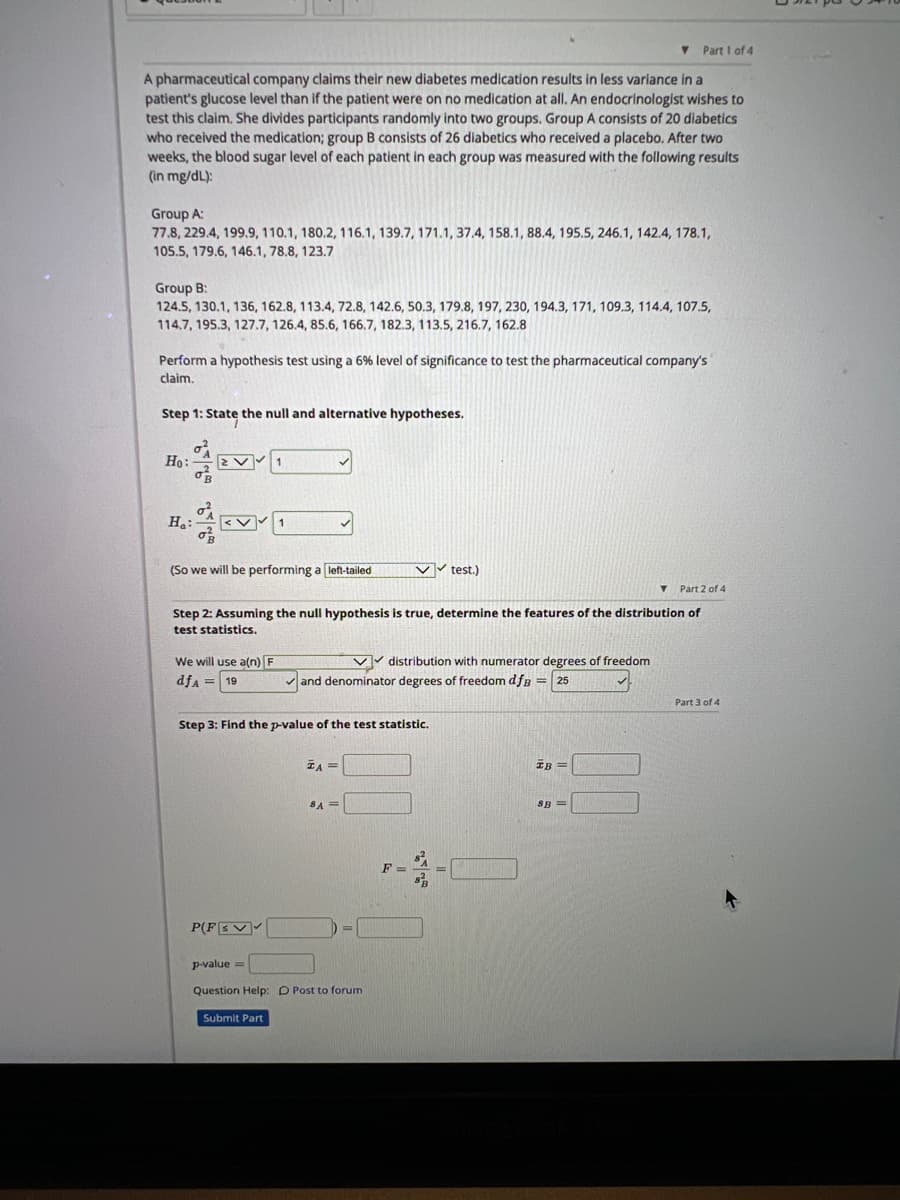
Transcribed Image Text:Part 1 of 4
A pharmaceutical company claims their new diabetes medication results in less variance in a
patient's glucose level than if the patient were on no medication at all. An endocrinologist wishes to
test this claim. She divides participants randomly into two groups. Group A consists of 20 diabetics
who received the medication; group B consists of 26 diabetics who received a placebo. After two
weeks, the blood sugar level of each patient in each group was measured with the following results
(in mg/dL):
Group A:
77.8, 229.4, 199.9, 110.1, 180.2, 116.1, 139.7, 171.1, 37.4, 158.1, 88.4, 195.5, 246.1, 142.4, 178.1,
105.5, 179.6, 146.1, 78.8, 123.7
Group B:
124.5, 130.1, 136, 162.8, 113.4, 72.8, 142.6, 50.3, 179.8, 197, 230, 194.3, 171, 109.3, 114.4, 107.5,
114.7, 195.3, 127.7, 126.4, 85.6, 166.7, 182.3, 113.5, 216.7, 162.8
Perform a hypothesis test using a 6% level of significance to test the pharmaceutical company's
claim.
Step 1: State the null and alternative hypotheses.
Ho:
Ha:
(So we will be performing a left-tailed
Part 2 of 4
Step 2: Assuming the null hypothesis is true, determine the features of the distribution of
test statistics.
We will use a(n) F
dfA = 19
P(FEV
Step 3: Find the p-value of the test statistic.
Submit Part
✓✓test.)
✓and denominator degrees of freedom dfB = 25
TA =
8A =
p-value=
Question Help: D Post to forum
distribution with numerator degrees of freedom
IB =
SB=
Part 3 of 4
Expert Solution
This question has been solved!
Explore an expertly crafted, step-by-step solution for a thorough understanding of key concepts.
Step by step
Solved in 3 steps with 1 images

Recommended textbooks for you

Glencoe Algebra 1, Student Edition, 9780079039897…
Algebra
ISBN:
9780079039897
Author:
Carter
Publisher:
McGraw Hill

Holt Mcdougal Larson Pre-algebra: Student Edition…
Algebra
ISBN:
9780547587776
Author:
HOLT MCDOUGAL
Publisher:
HOLT MCDOUGAL

Big Ideas Math A Bridge To Success Algebra 1: Stu…
Algebra
ISBN:
9781680331141
Author:
HOUGHTON MIFFLIN HARCOURT
Publisher:
Houghton Mifflin Harcourt

Glencoe Algebra 1, Student Edition, 9780079039897…
Algebra
ISBN:
9780079039897
Author:
Carter
Publisher:
McGraw Hill

Holt Mcdougal Larson Pre-algebra: Student Edition…
Algebra
ISBN:
9780547587776
Author:
HOLT MCDOUGAL
Publisher:
HOLT MCDOUGAL

Big Ideas Math A Bridge To Success Algebra 1: Stu…
Algebra
ISBN:
9781680331141
Author:
HOUGHTON MIFFLIN HARCOURT
Publisher:
Houghton Mifflin Harcourt